


How Does A Spectrophotometer Work?
Spectrophotometry Components | Spectrophotometer Design | More Resources
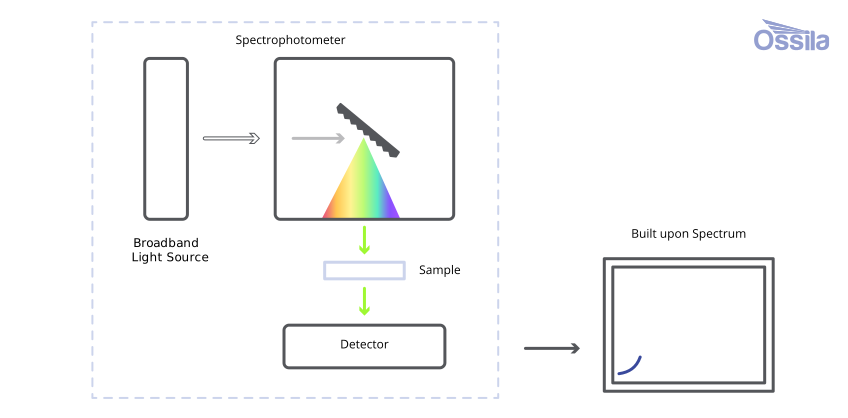
Spectrophotometers are analytical instruments that measure the intensity of light as a function of wavelength. This measurement is usually taken after a broadband light source is transmitted through a sample for either an absorbance or transmittance measurement. The four most important components that a spectrophotometer needs are:
- A light source
- A monochromator
- A sample holder
- A detector
Generally speaking, this is how a spectrophotometer works:
- Light from a broadband light source is dispersed by the diffraction element (in this case a diffraction grating) within a monochromator.
- The monochromator transmits a narrow band of wavelengths into the sample chamber.
- This section of dispersed light travels towards a detector, after passing through the sample.
- The diffraction element rotates, allowing the monochromator to select or scan through different wavelengths.
- The detector measures intensity at each wavelength, building an absorbance spectrum.
This wavelength-by-wavelength approach means spectrophotometers can measure smaller signals with higher accuracy and resolution compared with modular, array-based spectrometers.
Spectrophotometer Components
Each component within a spectrophotometer must be carefully considered and calibrated to ensure the system maintains high precision and accuracy.
-
The Light Source
Absorbance and transmission measurements require a broadband (white) light source. This can be a halogen bulb, arc lamp or an LED light source. For standard absorbance measurements, this light source needs to have a significant output across at least the visible light spectrum (380 - 780 nm).
However, spectrophotometers differ from spectrometers as they split broadband light into component wavelengths before measurement, while spectrometers use CCD arrays to measure across the wavelength range entire wavelength range at once. USB spectrometers provide a fast measurement, but its measurement precision and sensitivity is limited.
Therefore, spectrophotometry instruments often use a strong broadband light source in combination with a monochromator, to create a tunable light source. The sample is only exposed to a small portion of light at a time, and the rotating diffraction grating within the monochromator allows users to choose this excitation wavelength. Combining a variable light source with a single pixel detector, these systems can measure low signals with higher accuracy and resolution compared to spectrometers.

The Ossila Tunable Light Source, is used in the spectrophotometer Alternative to this, you can use a monochromatic light source (i.e. a laser), but you will only be able to measure absorption at a specific wavelength. This is suitable for some absorbance measurements such as OD600 measurements used in microbiological studies.
-
A Sample Chamber
The placement and alignment of your sample within a spectrophotometer is important. The sample chamber is designed to ensure that sample positioning is consistent between experiments, improving reliability and repeatability. These systems often have specific sample holders for different materials e.g. for a thin film or an optical cuvette. These can also include attachments for filters to tailor and adapt measurements.
-
Light Intensity Detector
Once light has passed through the sample, its intensity needs to be quantified, using a photodetector. This photodetector will convert incident light into an electrical signal proportional to the incident light intensity. There are several types of photodetectors, suitable for different wavelengths and/or intensities of light. Silicon-based detectors are a common choice for visible light measurements. Additional electronics are also required to turn the signal from the photodetector into a meaningful number.
To improve accuracy and sensitivity, spectrophotometers use a single pixel detector. These have a greater measurement area that other alternatives, such as CCD arrays used in spectrometers, allowing them to measure lower signal changes improving sensitivity. However, they cannot distinguish between different wavelengths of light. This is why single pixel detectors must be combined with a monochromator, to separate light before measurement.
-
Monochromators
The light from the sample needs to be split into its component wavelengths as the detectors cannot distinguish between different wavelengths. This dispersion is achieved using a monochromator, which consists of an entrance slit, a diffraction grating (or less commonly a prism) and focussing mirrors. The diffraction grating disperses light, and rotates to direct a different portion of the spectrum towards an exit slit. This mechanism allows you to vary the output wavelength easily and reliably.
Spectrophotometer Design
Single vs. Double Beam Spectrophotometers
Spectrophotometers can be classified into two main configurations: single beam and double beam instruments. In a single beam configuration, light passes through only one path, so reference and sample measurements must be taken sequentially. Double beam systems split the light into two separate paths, allowing measurement of the reference and sample simultaneously.
This dual-path design makes double beam instruments more reliable, as they can account for any short-term variations in the light source intensity during measurement. However, this improved accuracy comes at the cost of increased complexity, making double beam systems more difficult to configure and typically more expensive than their single beam counterparts.
Resolving Power and Signal-to-Noise Ratio
Resolving power defines a spectroscopy system's ability to distinguish two closely-spaced spectral peaks as separate features. To characterize this, the instrument measures the spectrum of a monochromatic light source (such as a mercury or neon emission line). The full width at half maximum (FWHM) of the measured peak represents the instrument's spectral resolution. A narrower FWHM indicates better resolving power, meaning the system can distinguish peaks separated by smaller wavelength differences.


Where, Δλ is the FWHM of a line source and λ is the wavelength at which the measurement was taken.
An instrument's sensitivity is usually quantified by its signal to noise ratio. This is the ratio of signal intensity to noise from unwanted sources.

Where Speak is the maximum intensity of the signal, Snoise is taken where there is no peak, and Nrms is the root mean square of the background noise.
There are multiple components within a spectrophotometer that will contribute to the overall systems resolving power and measurement sensitivity. However, optimizing one often comes at the expense of the other. It is therefore a balancing act to ensure both resolving power and signal-to-noise values are maximized within the given wavelength range.
- If the monochromator uses a blazed diffraction grating, the light will be diffracted with the greatest efficiency (at the desired diffraction order) at the grating blaze wavelength. Therefore, the instrument will have high sensitivity to signals at this wavelength, with sensitivity decreasing at wavelengths further from the blaze peak. Diffraction gratings should be chosen carefully to optimize light separation within the visible wavelength range. Diffraction groove density also impacts the balance of signal intensity to resolving power. Increased groove density increases dispersion angle, which improves wavelength accuracy, but limits transmitted signal intensity.
- In systems using a rotating diffraction grating, a monochromators ability to select a specific wavelength depends partially on the step size of the turning motor used. This affects wavelength selection accuracy and therefore resolving power.
- Adjustable slits give users the ability to tune both spectral resolution and signal intensity. For example, increasing the exit slit width from the monochromator will increase signal intensity as more light is passed through the sample into the detector. However, this reduces the resolving power of a monochromator, as a larger range of wavelengths are allowed through.
- The other major component that will affect instrument resolution and sensitivity is the detector. Most spectrophotometers use a single pixel detector which collects signals over a larger area compared to array-based detectors. This allows a higher sensitivity compared to USB spectrometers.
- The sensitivity of a detector depends massively on the type of detector used. Silicon-based photodiode detectors offer excellent linearity and fast response times in the visible light region with quantum efficiencies between 60-80%. Meanwhile, photomultiplier tubes (PMTs) can achieve higher sensitivities (10-1000 x more sensitive) than photodiodes. This makes PMTs ideal for measuring low signal intensities, such as fluorescence measurements, samples with high absorbance coefficients and low-light detection experiments.

Reducing Stray light, Aberrations and Other Sources of Error
Errors can come from a range of places in spectrophotometry measurements.
Aberrations are errors caused by the optical components design and configuration, often resulting in a blurred or distorted measurement.
The use of lenses can introduce chromatic aberrations, whereas using only reflective elements eliminates this effect. However, the use of concave mirrors can introduce spherical aberrations.

Incorrect alignment of mirrors and other components within a spectrophotometer can also cause astigmatism, where the focal points of the horizontal and vertical components don’t align and the light signal becomes “stretched”. Aberrations have the unusual impact of reducing both spectral resolution and signal-to-noise ratio simultaneously.
Stray light refers to any measured light outside of the desired measurement bounds. In fluorescence spectroscopy, stray light includes scattered excitation light, solvent Raman emission, and any other measurement of light from wavelengths outside the desired emission wavelength. For absorbance measurements, stray light sources can come from ambient light entering the system, or from scattering or fluorescence from the sample. Reducing stray light is incredibly important for accurate spectrophotometry measurements.
Any imperfections in optical components (such as mechanical imperfections or surface roughness in mirrors or gratings) can lead to stray light. Multiple reflections from these imperfections can cause small bright spots within the instrument. These are known as ghost images. Ghost images can also be seen as unexplained peaks in a measurement.
All spectrophotometers exhibit some baseline stray light, but this should aim to be less than 1% of incident intensity with proper instrument design, by maintaining a darkened environment.
Additionally, ambient light can leak into a spectrophotometry system contributing to the background signal, increasing noise in a measurement. This can significantly interfere with low intensity measurements.
More Resources
 Fluorescence Spectroscopy: Theory, Instrumentation & Uses
Fluorescence spectroscopy measures fluorescence, a process where light is quickly reemitted from a material absorbing incident photons. Unlike phosphorescence, fluorescence occurs almost instantly, making it ideal for analyzing optical properties in materials. The term fluorescence is often used interchangeably with photoluminescence.
Read more... How to Use a Spectrophotometer?
Spectrophotometers provide a reliable and accessible way to characterize optical properties from a thin film or of a species in solution. When done correctly, this technique can reveal intricate details about the molecular structure and optical properties of a sample.
Read more...Contributing Authors
Written by
Application Scientist
Images by
Application Scientist