
Solar Cell I-V Test System
Reliable and Accurate Characterization of Photovoltaic Devices
Take control of your research with simple solar cell measurements
Overview | Specifications | Features | Gallery | Software | In the Box | Accessories | Resources and Support
The Ossila Solar Cell I-V System is a low-cost solution for reliable characterization of photovoltaic devices. The PC software (included with all variants of the system) measures the current-voltage curve of a solar cell and then automatically calculates key device properties. In addition, I-V measurements can be performed periodically over time to track the stability of these properties. Just plug in the system, install the PC software, and you're ready to go! The intuitive interface and clean design makes the Solar Cell I-V System easy-to-use, simplifying the characterization of solar cells.
The system is available with either manual or automatic pixel switching (if you are using one of Ossila's substrate systems), or without a test board for use with your own substrate and testing system or if you already own one of our test boards. The Solar Cell I-V Test System is also available as part of the Solar Cell Testing Kit for easy solar cell characterization.
Complete Solar Cell Testing Kit

Simple Characterization
Calculate device metrics
with intuitive software
Affordable Testing
In your photovoltaic
device research
Free Software
Fully customizable measurements
Range of Measurements
Wide voltage and current measurements
What is Automatic Pixel Switching?
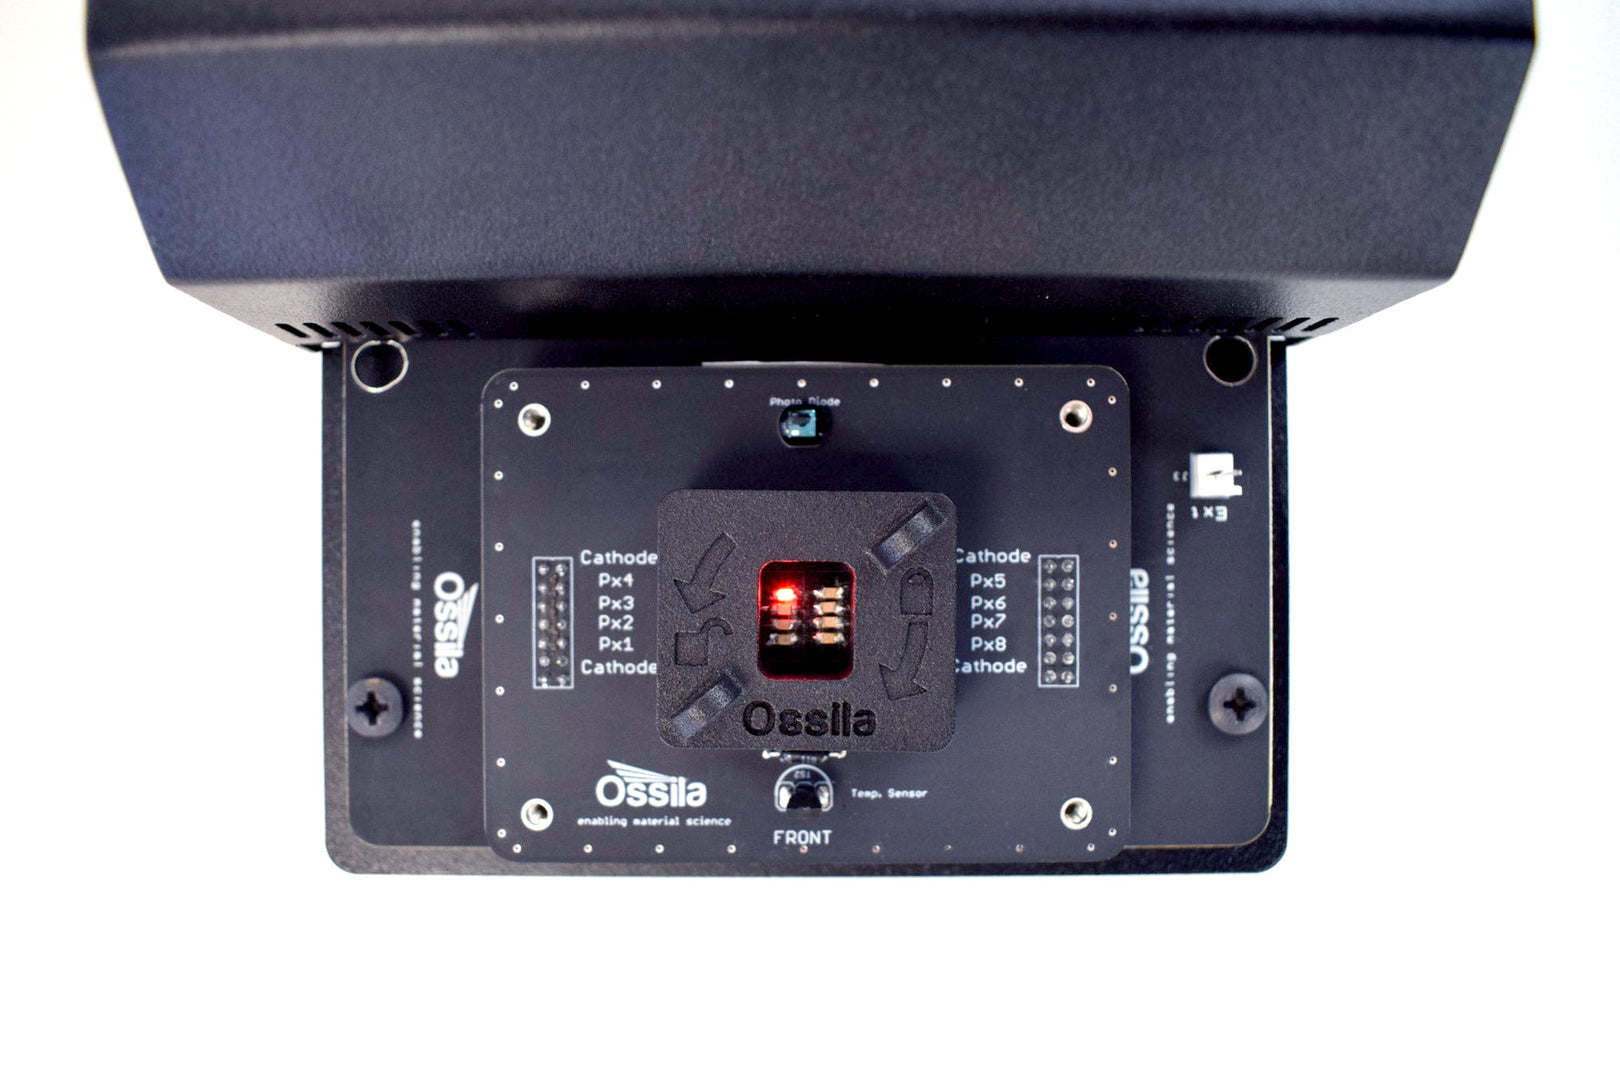
When you fabricate solar cells, you may create several individual cells on a single substrate. At Ossila, we call these individual cells pixels, and we refer to the full substrate as a device. For example, if you use our 25 mm square multi-electrode deposition mask (E2001A1) with a 25 mm ITO glass substrate (S2006C1), you will produce four separate solar cells on a single substrate. This gives you a device with four pixels.
Automatic pixel switching connects to each pixel on your device, without manual reconfiguration, to speed up your measurements and enable lifetime metric tracking for multiple pixels.
Specifications
Voltage Source
| Range | Accuracy | Precision | Resolution |
|---|---|---|---|
| ± 10 V | 10 mV | 333 µV | 170 µV |
Voltage Measure
| Range | Accuracy | Precision | Resolution |
|---|---|---|---|
| ± 10V | 10 mV | 50 µV | 10 µV |
Current Measure
| Range | Accuracy | Precision | Resolution | Burden |
|---|---|---|---|---|
| ± 200 mA | ± 500 µA | 10 µA | 1 µA | <20 mV |
| ± 20 mA | ± 10 µA | 1 µA | 100 nA | <20 mV |
| ± 2 mA | ± 1 µA | 100 nA | 10 nA | <20 mV |
| ± 200 µA | ± 100 nA | 10 nA | 1 nA | <20 mV |
| ± 20 µA | ± 10 nA | 1 nA | 0.1nA | <20 mV |
Physical Specifications


| Substrate Compatibility |
S211
(T2002B, T2003B) S2006 (T2002E, T2003E) S241, S251 (T2002F, T2003F) |
|---|---|
| Automated System Dimensions (W x H x D) | 150 mm x 55 mm x 300 mm (5.91" x 2.17" x 11.81") |
| Manual System Dimensions (W x H x D) | Source Measure Unit: 125 mm x 55 mm x 185 mm (4.92" x 2.17" x 7.28") Test Board (T2002B/T2002E): 105 mm x 40 mm x 125 mm (4.13" x 1.57" x 4.92") Test Board (T2002F): 100 mm x 40 mm x 150 mm (3.94" x 1.57" x 5.91") |
System Selection Guide
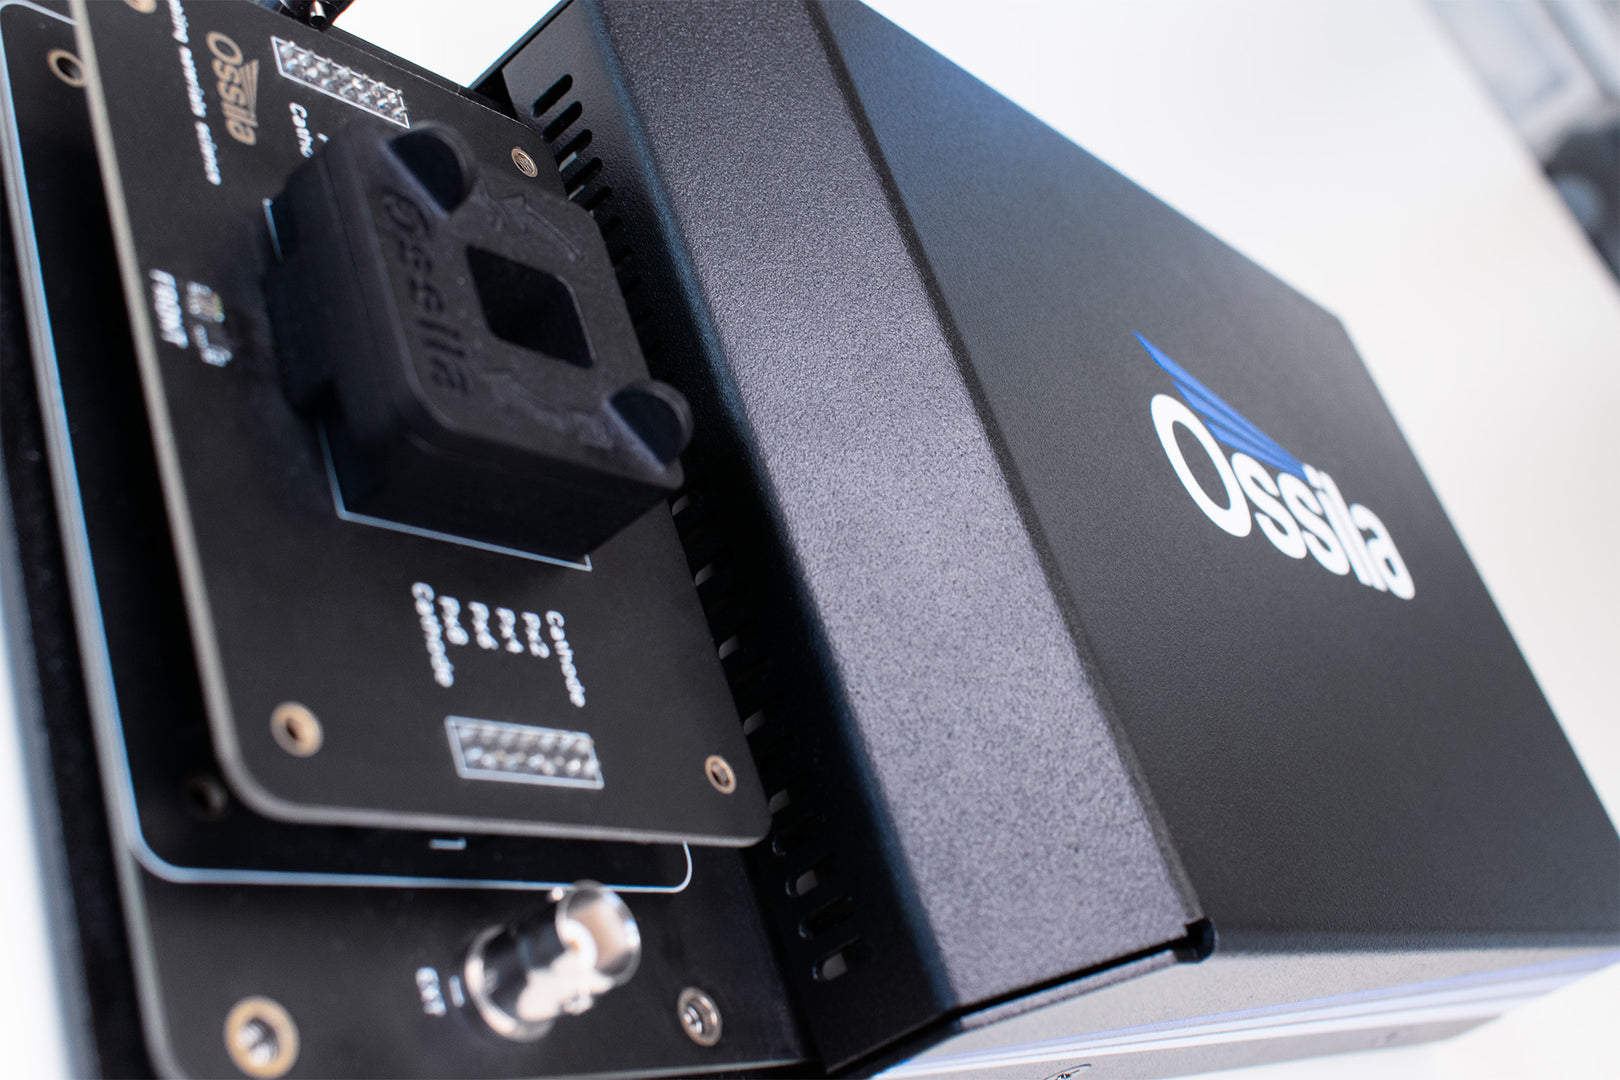
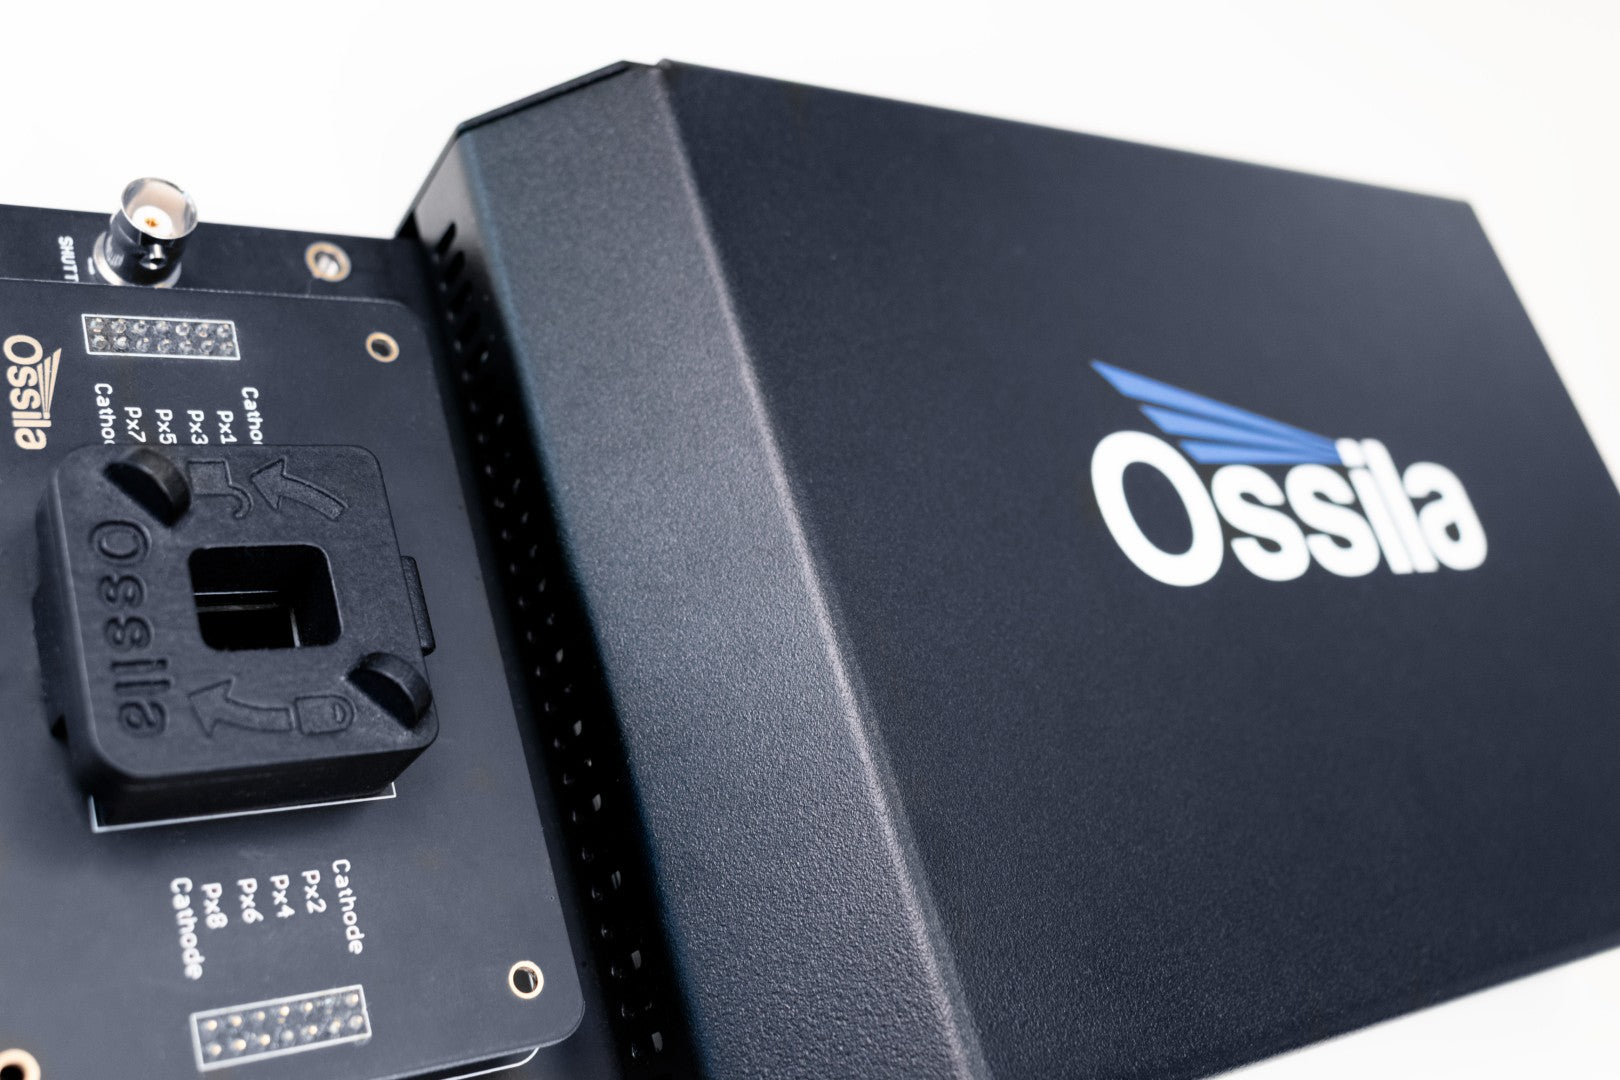
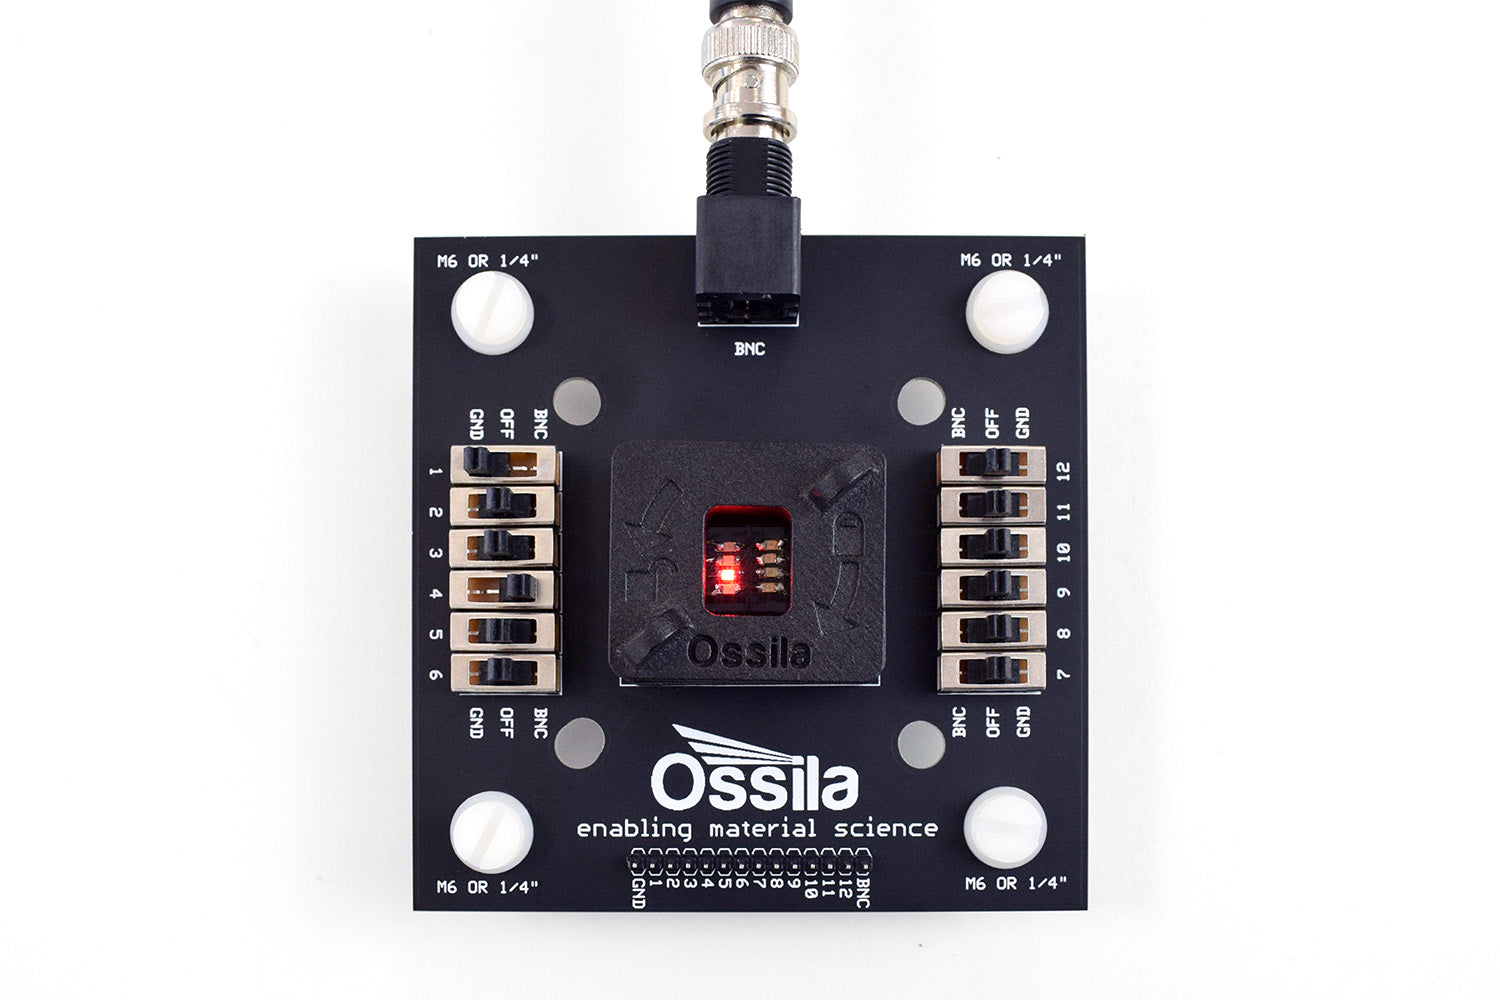
The manual version of the system has switches on the test board itself, which the user operates to measure the different pixels on a solar cell device. The automated version of the system uses a multiplexing test board, which switches between these pixels automatically. Test boards for the manual system and user-swappable riser boards for the automated system can be purchased separately.
| Manual Test System | Automated Test System | |
|---|---|---|
| ±10 V Source Range | Yes | Yes |
| 170 μV Source Resolution | Yes | Yes |
| ±200 mA Measurement Range | Yes | Yes |
| ±10 nA Measurement Resolution | Yes | Yes |
| Software Included | Yes | Yes |
| Automatic Solar Cell Characterization | Yes | Yes |
| Single Pixel Solar Lifetime Measurement | Yes | Yes |
| Automatic Pixel Switching | No | Yes |
| Multiple Pixels Solar Lifetime Measurement | No | Yes |
A solar simulator is needed to obtain standard efficiency measurements. The Ossila Solar Cell I-V Test System is now available as a solar cell testing kit with our solar simulator.
Substrate Compatibility
| Substrate | Manual Test System | Automated Test System |
|---|---|---|
| S211 (20 mm x 15 mm) | T2002B | T2003B |
| S2006 (25 mm x 25 mm) | T2002E | T2003E |
| S241, S251 (75 x 25 mm) | T2002F | T2003F |
Solar Cell I-V Test System Features

Calculates Device Properties
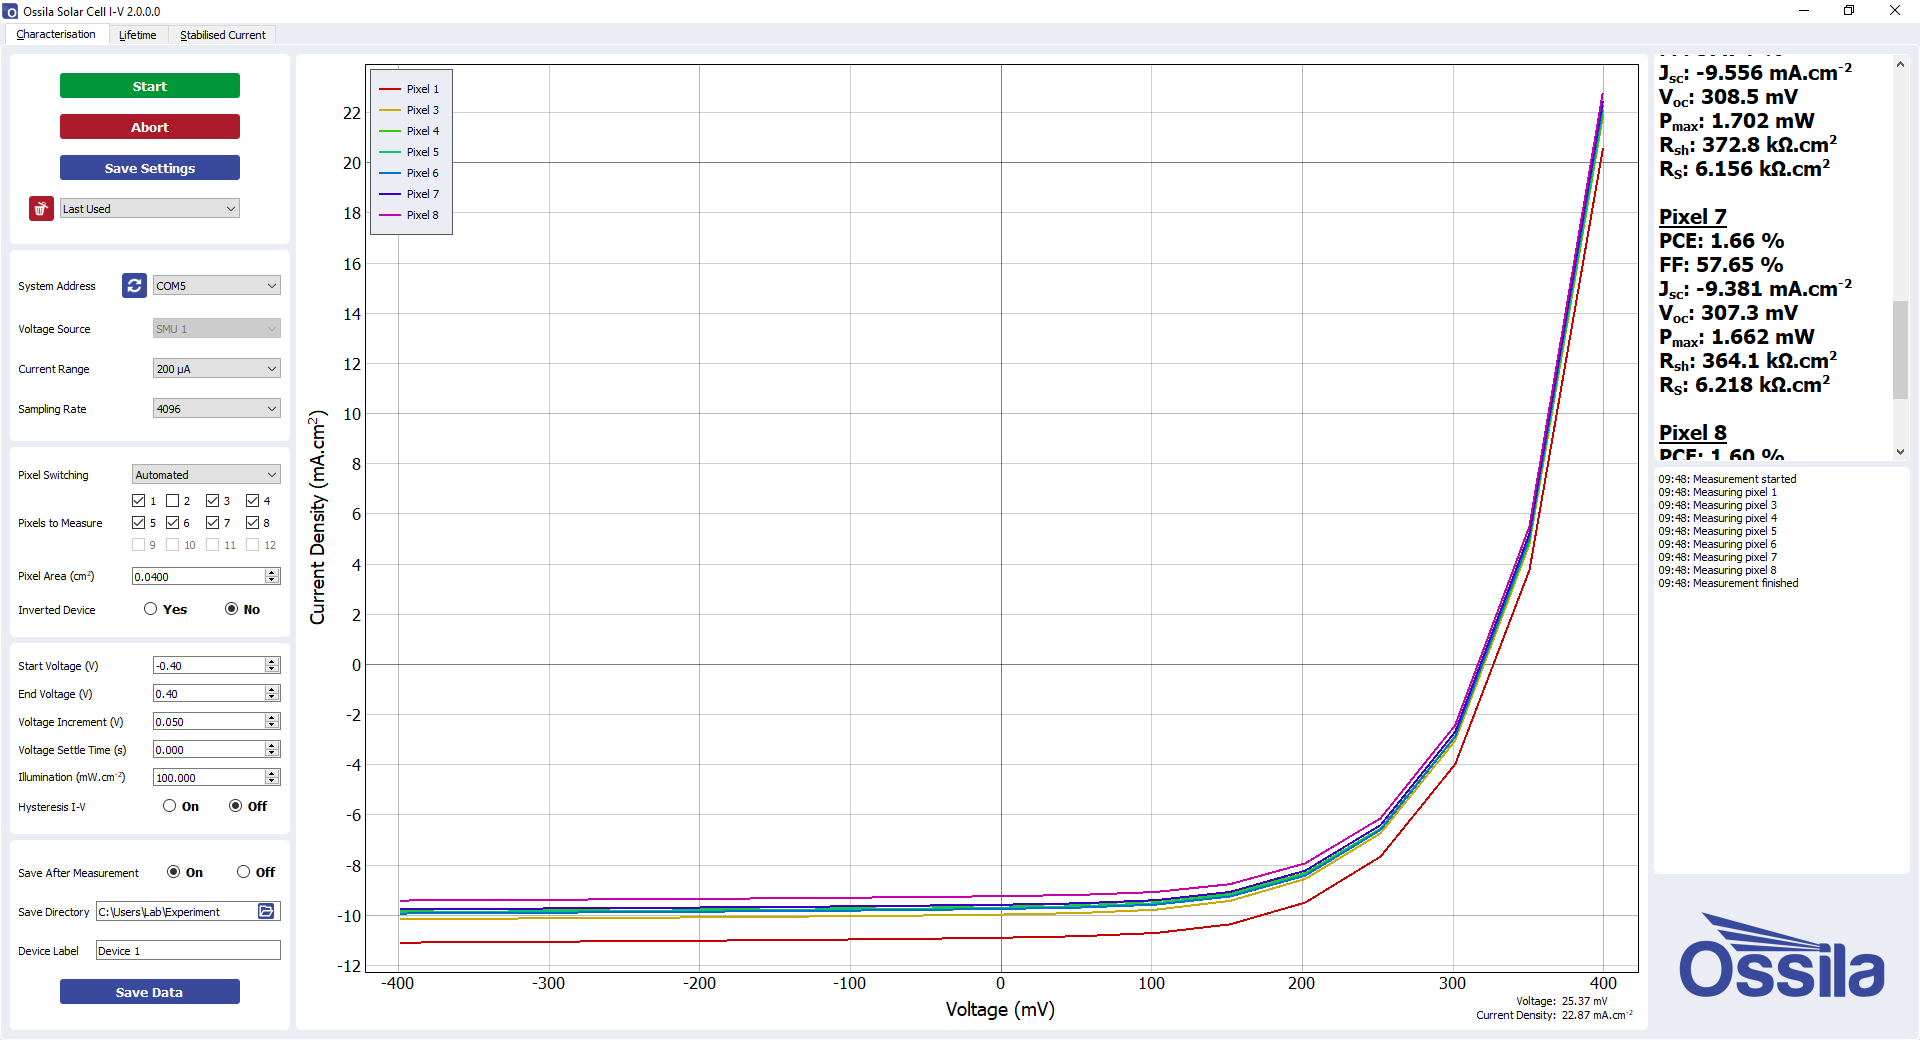
The included PC software automatically calculates key properties of solar cells from the measured I-V curves. These properties include: the power conversion efficiency (PCE), fill factor (FF), short-circuit current density (Jsc), open-circuit voltage (Voc), maximum power (Pmax), shunt resistance (Rsh), and series resistance (Rs).
Rapid Characterization
If you are using one of our substrate systems, the Solar Cell I-V System can be purchased with a multiplexing test board (just select the 'automated' variant of your choice in the drop-down list), which enables automatic pixel switching. As an added bonus, the temperature and light will also be recorded during the measurement!
Wide Measurement Range
The system is capable of delivering voltages between -10 V and +10 V, with a maximum resolution of 170 μV, and measuring currents from as low as ±10 nA up to ±200 mA.
Measure Device Stability
By performing repeated current-voltage measurements over an extended period of time, the stability of key device properties can be tracked.
Solar Cell I-V Test System Gallery
Software
With the PC software, you can:
- Perform current-voltage measurements anywhere between -10 V and 10 V.
- Take high resolution measurements, with voltage increments as low as 170 µV.
- Manage the experiment more directly, with custom settle times between applying voltage and measuring current.
- Measure device hysteresis by perform consecutive measurements in forwards and backward directions.
The software has 4 measurement tabs: Solar Cell Characterization, Stabilized Current Output, Solar Lifetime Measurement and Maximum Power Point Tracking. 'Characterization' performs I-V measurements and calculates the important device properties, the 'Stabilized Current' tab allows you to determine how the current output of your device evolves over time using, and the 'Lifetime' tab enables you to track key device properties (PCE, FF, Jsc, Voc) over an extended time by performing periodic I-V characterization. Between measurements the solar cell can be held at open-circuit, short-circuit, or maximum power. The 'Maximum Power Point' tab tracks the maximum power point over time, as well as the current density Jmp and operating voltage Vmp.
Software Requirements
| Operating System | Windows 11 (64-bit) |
|---|---|
| CPU | Dual Core 2 GHz |
| RAM | 4 GB |
| Available Hard Drive Space | 233 MB |
| Monitor Resolution | 1680 x 1050 |
| Connectivity | USB 2.0, or Ethernet (requires DHCP) |
In the Box
Automated System
- Automated Solar Cell I-V
- Riser board for substrate system of choice
- Resistor test device
- Power adapter (24 VDC)
- USB-B cable
- USB drive pre-loaded with the user manual, software installer, and quality control data
- USB Driver with QC test data
Manual System
- Source Measure Unit
- Test board for substrate system of choice
- BNC cable
- Resistor test device
- Power adapter (24 VDC)
- USB-B cable
- USB drive pre-loaded with the user manual, software installer, and quality control data
- USB Driver with QC test data
Accessories and Related Products


Resources
FTO Substrates: Adapting Unpatterned Substrates for Photovoltaic Devices
As part of our photovoltaic substrate system, Ossila offers patterned indium tin oxide (ITO) substrates which are designed to work with our evaporation masks to create multi pixel devices. The electrode contacts on the ITO substrate also align with the connection pins in our electronic test boards, which lets us measure devices quickly and easily.
Learn more...