


Exploring Signal-To-Noise Ratio of the Ossila Spectrofluorometer
Jump to: Measuring Signal-to-Noise Ratio | FKS5 Fluorescence Slides | Fluorophore Concentration Study | SNR with Slit Width
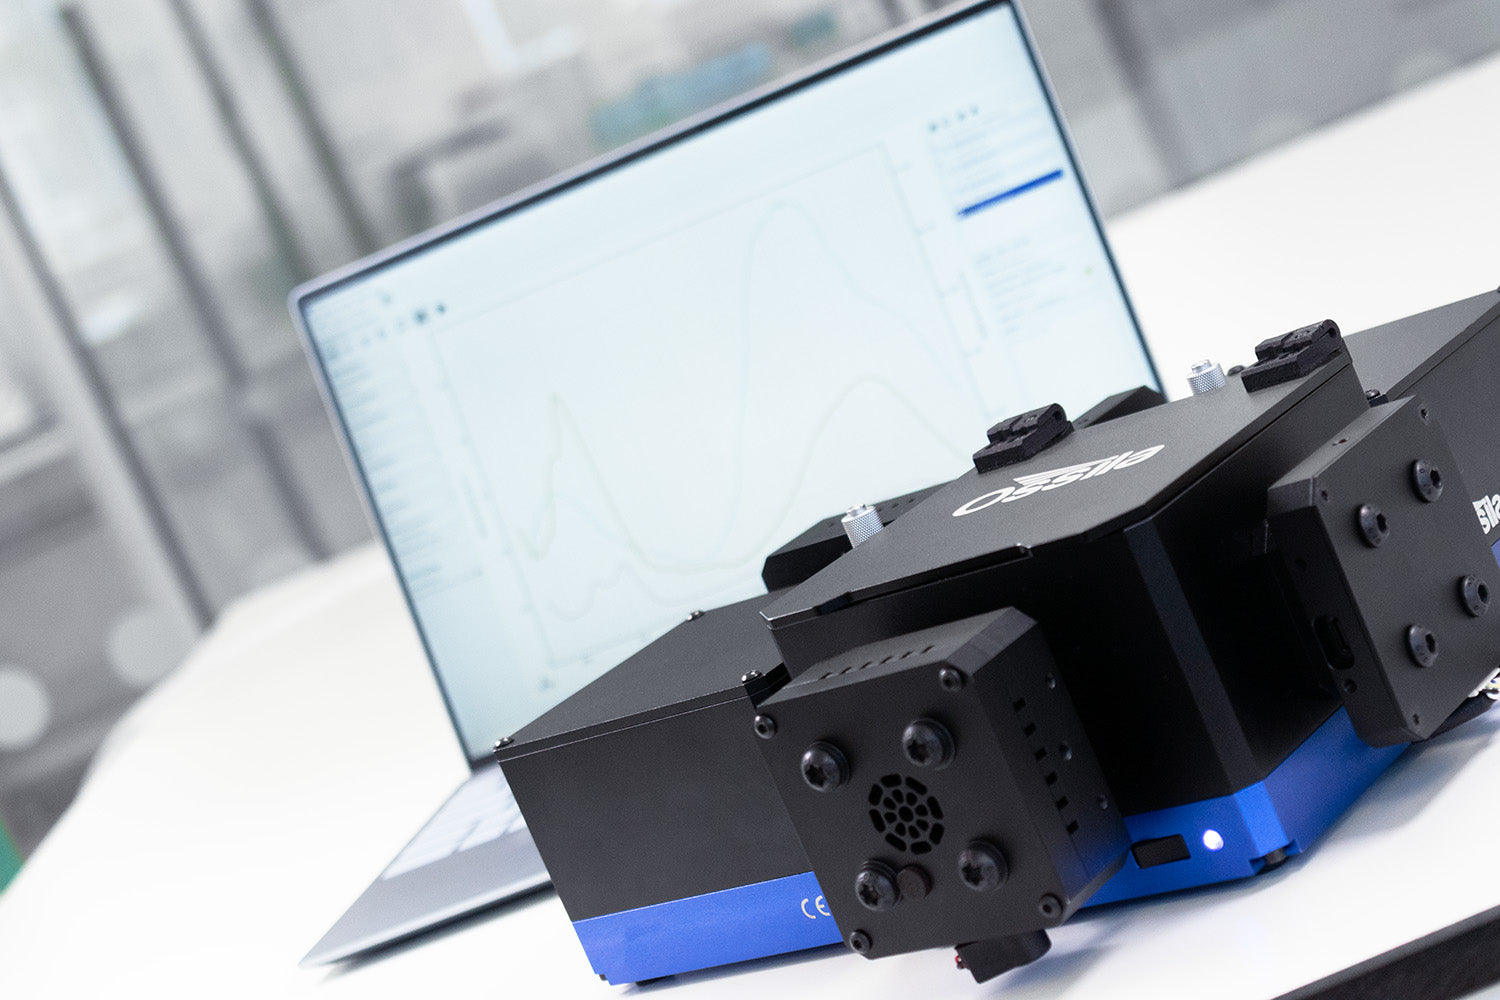
A common method of measuring signal to noise ratio of spectrofluorometers is to measure the Raman peak of water at 397 nm compared to 450 nm (where no Raman peak is present), illuminating at 350 nm. This is a suitable demonstration for the Ossila Spectrofluorometer as it is outside of the systems usable wavelength range.
However, without a standard measurement, taking one fixed value for signal to noise ratio becomes more difficult. Therefore, we have taken various measurements to explore the sensitivity range of the spectrofluorometer under various conditions.
Firstly, we measured various fluorescent microscope slides (Thorlabs FSK5) to provide an easy standard measurement that can be easily replicated. This method revealed a maximum SNR of 26,000:1.
Secondly, we dissolved a well-characterized fluorophore (4CzIPN) at various concentrations in toluene. 4CzIPN is a thermally activated delayed fluorescence material. It is a popular TADF-OLED material due to its high PLQY. Signal-to-noise will obviously be affected by the height of the signal, but we hope this study will help demonstrate the measurement capabilities of the Ossila Spectrofluorometer using actual organic fluorophores. This achieved a maximum SNR of 5000:1.
Finally, to explore the full potential of Spectrofluorometer sensitivities, we tracked signal to noise ratio by varying the slit width entering the monochromator detector. With this, the system can achieve SNR of up to 80,000:1 with minimal impact on resolution (measured through FWHM).
Measuring Signal-to-Noise Ratio (SNR)
We have chosen to use the RMS method to calculate signal to noise ratio from these fluoroesence measurements. This follows this equation:

Where the signal value (Speak) was measured at the peak of each measurement, with the noise measurement (Snoise) taken at 800 nm where there is no signal.
NRMS represents the background noise of the spectrofluorometer. This is calculated separately from the main signal, where a dark spectra is taken. This NRMS is calculated according to the following equation:

FKS5 Fluorescent Slides

The ideal orientation of the fluorescent slides was found any measurements taken. This sample is then excited with the UV light source (at 365 nm) while the spectrofluorometer scanned through various emission wavelengths (485-800 nm with a 1 nm wavelength step).
The fluorescence spectra for each FKS5 fluorescent slide is shown above, with the SNR in the table below. This varies from 2,000:1 for the lowest intensity emission, to 26,000:1 for the maximum sample.
| Sample | SNR |
|---|---|
| Green | 26,000:1 |
| Yellow | 16,000:1 |
| Orange | 9,000:1 |
| Red | 2,000:1 |

The fluorescence spectra for each FKS5 fluorescent slide is shown above, with the SNR in the table below. This varies from 2,000:1 for the lowest intensity emission, to 26,000:1 for the maximum sample.
Fluorophore Concentration Study
Fluorescence Emission Spectra
We varied the concentration of the TADF material, 4CzIPN, to explore the signal-to-noise ratios at various molarities. The solution was dissolved in toluene and excited with the UV light source (at 365 nm) and the spectrofluorometer scanned through various emission wavelengths (405-800 nm with a 5 nm wavelength step).

For the 10-4 -10-6 M solutions there is a significant reduction in peak intensity with reducing fluorophore concentration (as expected). However, there is a significant reduction in PL intensity for the 10-3 solution. There also appears to be slight red shift in the fluorescence peak of the 10-3 molarity solution (although the wavelength step used in this experiment is too large to probe this shift in any detail). These effects are likely caused by the aggregation of 4CzIPN molecules in higher concentrations.
Signal-to-Noise Ratio
The resulting values of signal-to-noise ratio are as follows.
| Concentration of Fluorophore | SNR |
|---|---|
| 10-3 | 3400:1 |
| 10-4 | 5300:1 |
| 10-5 | 2200:1 |
| 10-6 | 230:1 |
As expected, increasing peak leads to increased SNR. The peak SNR value is 5000:1. This value falls when the count number falls below 1000.
At Lower Concentrations (10-7 – 10-8)

At lower concentrations, the likelihood of 4CzIPN molecules interacting with the incoming light reduces, therefore background illumination appears to overwhelm the signal.
However, if you have taken a background measurement, by comparing the normalized PL of the signals to the normalized background signal, you can still see the presence of the 4CzIPN peaks.

SNR Variation with Slit Width
To fully examine achievable measurement sensitivity, we measured the FKS5 sample with the highest signal (green - 503 nm emission) at various slit widths. The slit width varied changes the amount of light that enters the monochromator that dispersed light before hitting the SiPM detector.

| Slit Width | SNR | Slit Width | SNR |
|---|---|---|---|
| 25 μm | 2,000:1 | 150 μm | 32,000:1 |
| 50 μm | 9,000:1 | 200 μm | 49,000:1 |
| 75 μm | 16,000:1 | 300 μm | 60,000:1 |
| 100 μm | 26,000:1 | 400 μm | 81,000:1 |
| 125 μm | 27,000:1 | 500 μm | 73,000:1 |
SNR greatly increases with increasing slit width, reaching maximum values of 81,000:1.
It is important to bear in mind that increasing slit width of the detector’s monochromator increase sensitivity can reduce the system resolution. However, this also depends on the narrowness of the emission peak itself.
To explore the impact of this in this measurement, we measured the FWHM for each peak. We found that increasing slit width makes little difference on peak resolution until a slit width of over 100 μm width. Even after this point, the increase in FWHM compared to the peak intensities is minimal.
| Slit Width | FWHM | Slit Width | FWHM |
|---|---|---|---|
| 25 μm | 52 | 150 μm | 56 |
| 50 μm | 52 | 200 μm | 59 |
| 75 μm | 53 | 300 μm | 65 |
| 100 μm | 53 | 400 μm | 70 |
| 125 μm | 55 | 500 μm | 81 |