
Versatile, Low Price Optical Spectrometer
Compact system for UV-Vis-NIR spectroscopy measurements
Overview | Specifications | Features | Gallery | Software | In the Box | Accessories | Resources and Support
The Ossila USB Spectrometer brings affordable UV-Vis-NIR spectroscopy to research scientists worldwide in the wavelength range of 320 nm – 1050 nm. The fully programmable, modular design fits nicely into most existing optical spectroscopy labs, with a simple command library and trigger modes to make it easy to integrate into your workflow.
The compact CCD detector, fiber optic and USB compatibility, and intuitive free software mean you can quickly start measuring the optical properties of your samples. Our versatile and modular design allows you to analyze many different samples, including solutions and thin film samples.
Buy as an independent modular spectrometer or as a part of our complete USB Spectrometer Kit to get started straight away.
USB Spectrometer Kit

Two-Year Warranty
Buy with confidence
USB-C Powered
Power with your computer or laptop

Powerful Electronics
High-speed 16-bit, 500 kSPS ADC
Free Software
With free updates
Specifications
| Dimensions (D x W x H) | 78 mm x 78 mm x 38 mm (3.07" x 3.07" x 3.07") |
|---|---|
| Weight | 150 g (0.33 lb) |
| Wavelength Range | 320 nm – 1050 nm |
| Grating Blaze Wavelength | 500 nm |
| Resolution (FWHM) | 2.5 nm |
| Optical Input | SMA 905 fiber or free space |
| Entrance Slit Width | 25 µm |
| Connection Type | USB type-C |
| Communication Protocol | Serial-over-USB |
| Dark Noise* | <50 counts |
| Signal-to-Noise Ratio | >500:1 |
| Detector Type / Pixels | CCD / 1600 |
| Analog-to-Digital Converter | 16-bit, 500 kSPS |
| Data Transfer Speed* | Up to 100 fps (PC dependant) |
| Stray Light | <0.2% |
* Measured at 50 us integration time
View USB Spectrometer Kit specifications

What does the signal-to-noise ratio mean?
In order for a signal to be useful, it has to be significantly higher than the noise level. Therefore, an important property of spectrometers is the signal-to-noise ratio (SNR or S/N). This is a measure of the sensitivity of the spectrometer and compares the intensity of the signal, i.e. the spectral feature(s) you are looking at, to the intensity of the background noise.
SNR is often defined as the maximum signal height divided by the root mean square (RMS) of the noise in the background signal. It can be expressed as a ratio (e.g., 500:1) or in decibels (dB). If the ratio is greater than 1:1 (0 dB), the signal is greater than the noise.
The Ossila USB Spectrometer has a signal-to-noise ratio of > 500:1.
USB Spectrometer User Manual
USB Spectrometer Features
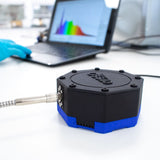
USB Powered
Power your optical spectrometer via the USB port. There is no need for an additional, dedicated power supply. Get up and running quickly and easily with either your computer or laptop - simply plug in via the USB port and begin measuring.
Dynamic Spectral Range
Capable of meauring the entire visible light spectrum, from the UV-A band to near infrared. With a range of 320 nm to 1050 nm and resolution of up to 2.5 nm, our system can be used to study a wide range of materials including photovoltaic, solar cell, OLED, biological, and 2D materials.
Fast Acquisition Speeds
A powerful Arm Cortex M4 processor works with a high-speed 16-bit, 500 kSPS, analog-to-digital converter. Our system can transfer over 100 frames-per-second to the host computer when running in internal trigger mode. Plus, a six port I/O expansion header allows for easy integration with other 5V equipment.
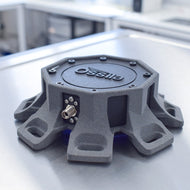
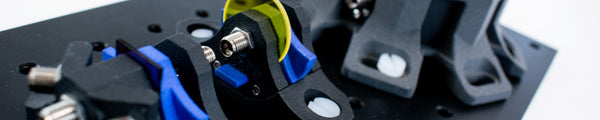
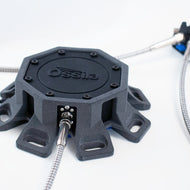
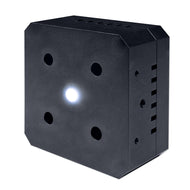
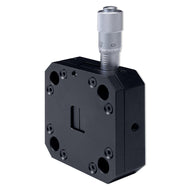
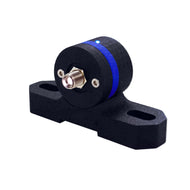
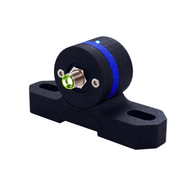
Compact and Modular Design
The clever design of the Ossila USB Spectrometer combines optical elements and internal electronics into an extremely small footprint. The result is a lightweight, compact but powerful UV-Vis-NIR spectrometer.
Internal and External Trigger Modes
Use in free-running mode, or integrate with other systems using the external trigger input. The rolling integration mode lets you control the integration time dynamically. With an output to synchronise acquisition with an external shutter plus two general purpose outputs, it features six I/O ports in total, including a ground port.
I have been using the Ossila USB Spectrometer in my research to measure absorption, transmission, and reflectivity. I highly recommend it to anyone who is looking for a cheap, fast, reliable and easy-to-use spectrometer for their optical experiments.
Kyriacos Georgiou, PhD, University of Cyprus
USB Spectrometer Gallery


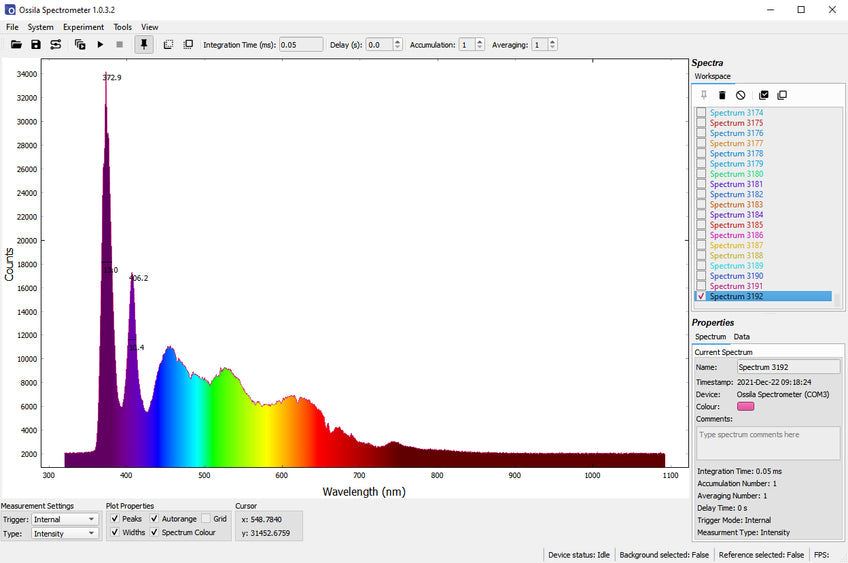
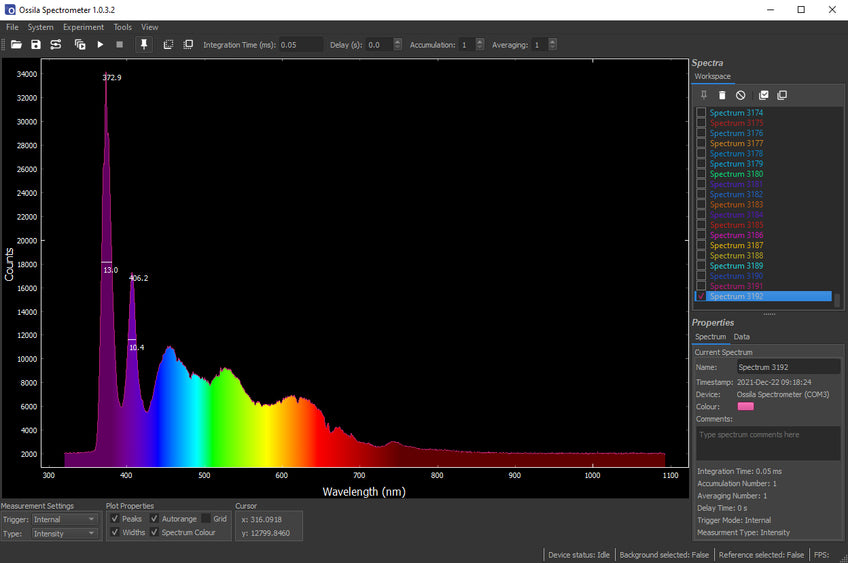
Spectroscopy Software
The Ossila USB Spectrometer comes with powerful spectroscopy software which makes it quick and easy to control the device and start collecting data.
Take background spectra and measure intensity, transmission/reflection, and absorbance measurements in just a few clicks. The spectroscopy software also features spectral averaging and accumulation, peak detection, offset and gain adjustment, and more - all via a straightforward user interface.
Software updates are provided at no extra charge and are available to download from our website.
Software Requirements
| Operating Systems | Windows 11 (64-bit) |
|---|---|
| CPU | Dual Core 2.0 GHz |
| RAM | 4 GB |
| Available Drive Space | 306 MB |
| Monitor Resolution | 1280 x 960 |
| Connectivity | USB 2.0 |
Command Library
The Ossila USB Spectrometer can be controlled using a simple serial command library; the device will appear as a COM port when connected to a PC. Commands can be sent via the command window in the spectroscopy software or via most programming languages. A full list of commands and example code is included in the user manual.
In the Box
USB Spectometer only:
- USB spectrometer
- USB Driver with QC test report
- USB-C power cable
- Detector filter for spectroscopy in the visible range
USB Spectometer Kit:
- Ossila USB Spectrometer (with test report, detector filter & power cable)
- Light sources: broadband white & UV
- Spectrometer case
- Sample holders: cuvette holder & four-port transmission sample holder
- SMA optical fiber x2
- Optical breadboard plate (150 mm x 300 mm)
- Optical mirror (20 mm x 15 mm)
Accessories and Related Products
Resources and Support
 What Features Do You Need In A Spectroscopy System?
Some factors that you should consider when choosing an optical spectrometer are the range of wavelengths you need to measure, the size and weight of the instrument, and its data collection capabilities.
Read more...