Choosing Spectroscopy Instruments

UV-Vis spectroscopy (or optical spectroscopy) is a simple but effective technique used to probe the molecular structure of a material. Measuring absorbance and emission of light from a sample can give you vital data about:
- Its molecular structure
- Its surroundings
- Any interactions with other molecules
- Any processes it goes through
Optical spectroscopy systems are as varied as the types of measurement you can do with them. Simple USB spectrometers, calibrated spectrofluorometers, fluorescence lifetime systems, and fluorescence microscopes all fall under the umbrella of spectroscopy systems. There are advantages and limitations to each of these techniques and instruments and each is tailored to suit different applications and needs.
Spectroscopy Equipment

About Your Measurements
Steady-State or Time Resolved Measurements
Steady-state spectroscopy measures any static optical properties (that won’t change over the measurement acquisition time), such as band gap measurement, absorbance peak identification, and fluorescence spectra. Both optical spectrometers and spectrofluorometers can easily perform steady-state measurements.
In contrast, time-resolved spectroscopy is used to measure dynamic properties like fluorescence lifetime, energy transfer processes, fluorescence quenching or to monitor sample interaction with its environment. Time-resolved spectroscopy measures fluorescence intensity decay after a brief excitation pulse. These measurements require more advanced instrumentation, including pulsed light sources (such as lasers or LEDs), fast timing electronics, and high-speed detectors. These setups often involve time-correlated single photon counting (TCSPC) or streak cameras and demand careful control of ambient light, often in a dark-room environment.
Steady-state measurements require constant excitation, but are not as limited by measurement speed as time resolved measurements.
Absorbance, Fluorescence and Transmission Spectroscopy
All these measurements can be taken with even the simplest spectroscopy systems. However, the type of light sources needed or the set up of your measurement may vary depending on which measurement you are doing.
| Absorbance | Fluorescence | Transmission |
|---|---|---|
|
Typically requires a broadband light source such as:
|
Requires a monochromatic light source, such as:
|
Typically requires a broadband light source such as:
|
|
Light travels directly through the sample Needs normal alignment of detector and light source compared to sample |
Light emitted at 90° angle relative to incoming beam to minimize scattering Needs perpendicular alignment of detector and light source compared to sample |
Light travels directly through the sample Needs normal alignment of detector and light source compared to sample |
What Specs Do You Need?
Most spectroscopy systems will quote specifications such as:
- Resolution or a resolving power. This defines how far apart two peaks will be before they can be distinguished
- Signal-to-Noise Ratio. This becomes important if you are measuring samples that are highly absorbent, or fluorescence with low intensity.
It is important to consider the resolution you will need in your measurements when building a spectroscopy lab. Ideally, you want the highest resolution and sensitivity you can, but you must consider equipment versatility and price. What specifications do you need for your measurements?

Technical Specifications
Wavelength Range
The first thing to consider when choosing a spectroscopy system is wavelength range. All spectrometers and detectors are calibrated within a certain spectral range. Make sure that your system has an appropriate wavelength range for your sample, as you will only be able to probe properties within that scope.
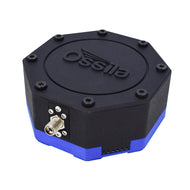
The Ossila USB Spectrometer can measure light between 320 nm - 1050 nm which corresponds to the transition energies of 1.2 eV - 3.8 eV. This is suitable for basic optical spectroscopy measurements, and some near infrared or near UV measurements. The Ossila Spectrophotometer and Spectrofluorometer have a similar range of 380-1000 nm.
These measurement ranges are suitable for studying:
- Chromophores
- Organic dyes
- Visible-light fluorescent molecules
- Most light-emitting or light-absorbing devices (OLEDs, PV, LEDs, some visible lasing materials, etc.)
Wavelengths between 700 nm - 2500 nm will probe some vibrational relaxation transitions, and can be measured by NIR spectroscopy. Mid-IR spectroscopy (2500 nm - 25 μm) can probe transitions vibrational and internal conversion transitions. These properties are outside the realms of Ossila's optical spectroscopy systems.
Spectral Resolution
The spectral resolution (SR) of a spectrometer determines how close two spectral peaks can be while still being resolved as separate. This value is dependent on different components depending on the type of spectrometer you are using.
- SR can be affected by any slit widths in a spectrometer or spectroscopy systems.
- If the system uses diffraction gratings, a higher grating density will increase resolution (although it will decrease signal intensity).
- USB spectrometers often use charged-coupled device (CCD) detectors. These use an array of smaller detectors to both differentiate between different wavelengths of light, and measure intensity. Therefore, increased pixel density in this array increases resolution. (However, again this lowers signal intensity).
- Monochromator-based spectroscopy systems use a monochromator to disperse light and a separate single pixel detector (such as a photomultiplier tube) to measure light intensity, wavelength by wavelength. The resolution of these systems can be affected by the diffraction gratings used in the monochromators.
- Furthermore, in these systems monochromators often use rotating diffraction gratings to select wavelength. Therefore, monochromator resolution also depends on the turning motor step size.
Acquisition Time
The speed of a spectroscopy measurement depends on both the optics of the spectrometer and the integration time set by the user.
Monochromator-based systems tend to have a slower measurement speed than CCD based spectrometers, as these systems measure light intensity at each wavelength individually. This method increases instrument sensitivity, but this larger measurement speed makes it difficult to measure dynamic processes. It can also unnecessarily increase overall experiment time, which can be an issue if you are measuring lots of samples.
Linear detector spectrometers (such as the USB spectrometer) measures the intensity of all wavelengths of light simultaneously, so have a faster measurement speed. You can increase the sensitivity of linear spectrometers by increasing the integration time of your measurement.
Ultrafast measurement speeds (sub-nanosecond range) are needed if you are doing pulsed spectrometry or want to measure extremely dynamic processes or fluorescence lifetimes. If you require this ultra-fast spectroscopy, you will need a specialist spectrometer with sensitive detectors. For standard steady-state optical spectroscopy, you don't need ultrafast measurement speed.
The USB spectrometer is designed to have a quick measurement speed while still taking good quality spectra. You can easily optimize integration times with our Ossila Spectroscopy Software. You can also use the spectral accumulation or averaging functions to improve the quality of your spectra while maintaining short measurement times.
Signal to Noise Ratio & Sensitivity
In any spectroscopy system, a high signal-to-noise ratio means a more accurate measurement. Signal-to-noise ratio represents how low the noise is compared to the signal intensity. Noise in a spectrometer can come from a variety of places: the dark current of your detector, the amount of stray light or spectral aberrations picked up with your signal, and any thermal noise. This is particularly problematic if your measurement has a low signal intensity, such as with fluorescent samples, or samples with high optical densities.
Signal intensity can be affected by the widths of any entrance or exit slit the light source travels through. Some spectrometers have fixed slit widths, like the USB Spectrometer and in these cases the slit widths are optimized to balance signal intensity and resolution. In larger systems like spectrophotometers or spectrofluorometers, slits are adjustable giving users more control in optimizing the trade-off between signal intensity and resolution.
Furthermore, signal-to-noise ratio will be lower in systems which have a larger dynamic range. This is the difference between the maximum and minimum measurable intensity signal. In fact, a spectroscopy system's sensitivity will be mostly determined by its detector. The sensitivity of a detector will depend on its quantum efficiency, signal to noise ratio, dynamic range and pixel area, as well as other qualities determined by the detector type.
In fact, a spectroscopy system's sensitivity will be mostly determined by its detector. The sensitivity of a detector will depend on its quantum efficiency, signal to noise ratio, dynamic range and pixel area, as well as other qualities determined by the detector type.
Spectrophotometers use single-pixel detectors, which have a greater collection area than the individual pixels in a CCD array. Therefore, these systems tend to offer higher sensitivity than modular, array-based USB spectrometers This larger detector area allows spectrophotometers to gather more light per measurement, reducing noise and improving the signal-to-noise ratio for low-intensity measurements.
The choice of detector also plays a significant role in overall sensitivity. Most spectrophotometers use silicon-based photodiode detectors, which offer good linearity and fast response times across the visible wavelength range, with quantum efficiencies of around 60–80%. For applications requiring the highest sensitivity, photomultiplier tubes (PMTs) are often preferred. PMTs can be 10–1000 times more sensitive than photodiodes, making them particularly well-suited to detecting very low signal intensities.
Practical Considerations
Price and Size
Some spectroscopy systems achieve high specifications by including expensive detectors, lenses and light sources. It is worth evaluating if you need this sophisticated optical set up. A more compact, adaptable, and affordable spectrometer could measure your samples perfectly well.
We designed the Ossila spectrometer to perform research-grade spectroscopy with a low cost, so you can start your optical experiments as soon as possible, no matter your budget.
What's more optics benches can quickly become overcrowded, so using space efficiently is important. Modular spectrometers can easily fir onto a busy optics bench, but will need other optics and proper alignment for resolved spectroscopy measurements. Enclosed systems will often have a larger lab footprint, but are usually stand alone.
Set Up and Lab Design
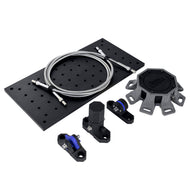
With many modular spectrometers, supplying all the accessories needed for optical spectroscopy measurements (sample holder, light sources, etc.) can quickly increase costs.
However, this is not the case with Ossila's USB Spectrometer Kit. This sets you up with all of the necessary equipment to start measuring immediately, at a reduced cost.
Most spectrofluorometers and spectrophotometers have a rigid, enclosed experimental set-up. This protects optical elements, ensures the system stays well-calibrated, and measurements stay consistent. The dark casing on these systems will also reduce background light noise.
An additional benefit of these systems is that you just place your sample in, and press go. They are stand alone systems, and require very little start up time. However, they can be more difficult to maintain as replacing individual components is more difficult than with modular systems.
Versatility
If you want a system where you can put your sample in and press go, spectrofluorometers are the spectroscopy system you need. With spectrofluorometers, you can do a lot of spectroscopy measurements with just the push of a button. However, if a measurement is out of their range, you can't do anything to change it.
On the other hand, one of the main benefits of USB spectrometers is that they can be easily incorporated into any optics lab and combined with other optical components to create the system you need. In this way, they are more versatile than monochromator based systems, allowing you to build exactly the spectroscopy lab you need, and to modify this regularly to measure different samples.
Spectroscopy Equipment & Components

Learn More
 Light Sources for Spectroscopy
Optical spectroscopy concerns light in the UV, visible and IR regions of the electromagnetic spectrum which is either emitted by, or interacts with, a sample. With our USB spectrometer, it can be performed using a range of different light sources.
Read more... Measuring Fluorescence with the Ossila Spectrofluorometer
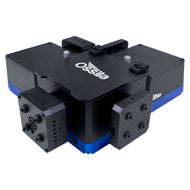
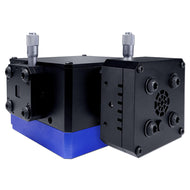
The Ossila Spectrofluorometer measures the fluorescence emission spectra of materials with high sensitivity and precision. The spectrofluorometer can take both excitation and emission measurements with the free Spectrophotometry software.
Read more...