Thin Film Fluorescence Measurement

Fluorescence occurs when photons are emitted from a material, due to stimulation from another incoming photon. Fluorescence measurements are usually taken in solution to isolate molecular properties. However, sometimes you need to measure fluorescence of a material as a solid or as a thin film, to inspect how it performs in a device.
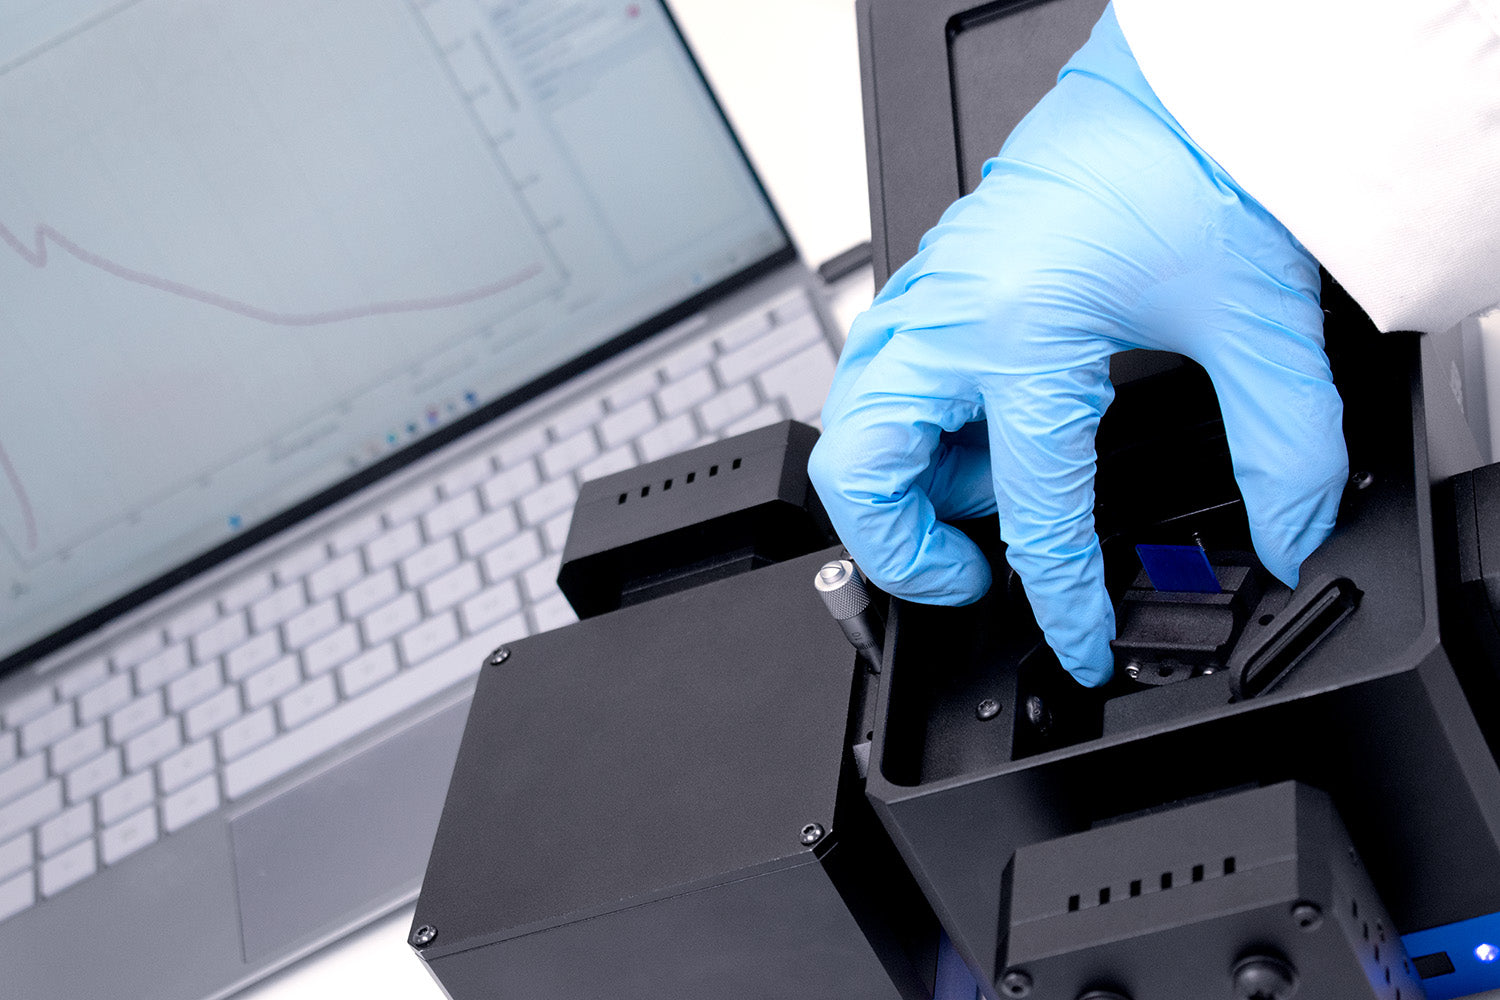
You can measure thin film fluorescence using a dedicated spectrofluorometer. These devices are self-contained units that align light sources, monochromators and detectors around a dedicated sample holder. Instruments like the Ossila Spectrofluorometer can accommodate thin films easily, and ensure consistent alignment between measurements, with sufficient light blocking and easy measurement.
You can use optical spectroscopy as a quick and easy way to characterize fluorescence from a thin film sample. The Ossila USB Spectrometer allows you to detect light between 360 nm - 1000 nm.
However, you will need an integrating sphere or a more complex system to measure quantitative measurements such as PLQY.
Fluorescence is emitted in all directions, so it is important to optimize your fluorescence spectroscopy set up to maximize signal. Additionally, when measuring thin film fluorescence, there are further set-up considerations:
- When measuring fluorescence from thin films, you must account for or reduce the measurement of reflected light- especially if you are using a specular substrate such as smooth glass.
- You must aim to reduce the impacts of any excitation light that travels through your sample.
- In a typical flat substrate, a considerable amount of emitted light will be guided to the edges of your sample.
- You will also have to consider how strongly your sample will fluoresce.
Measurement Angle
In order to excite electrons into a higher energy state, you must choose a high energy light source to illuminate your sample. However, when you measure thin films (especially if they are on a glass substrate), you need to consider that both the transmission and reflection of the excitation light may affect your measurement. Because of this, the angle that you take your fluorescence measurement at can make a substantial difference to your measured spectrum.

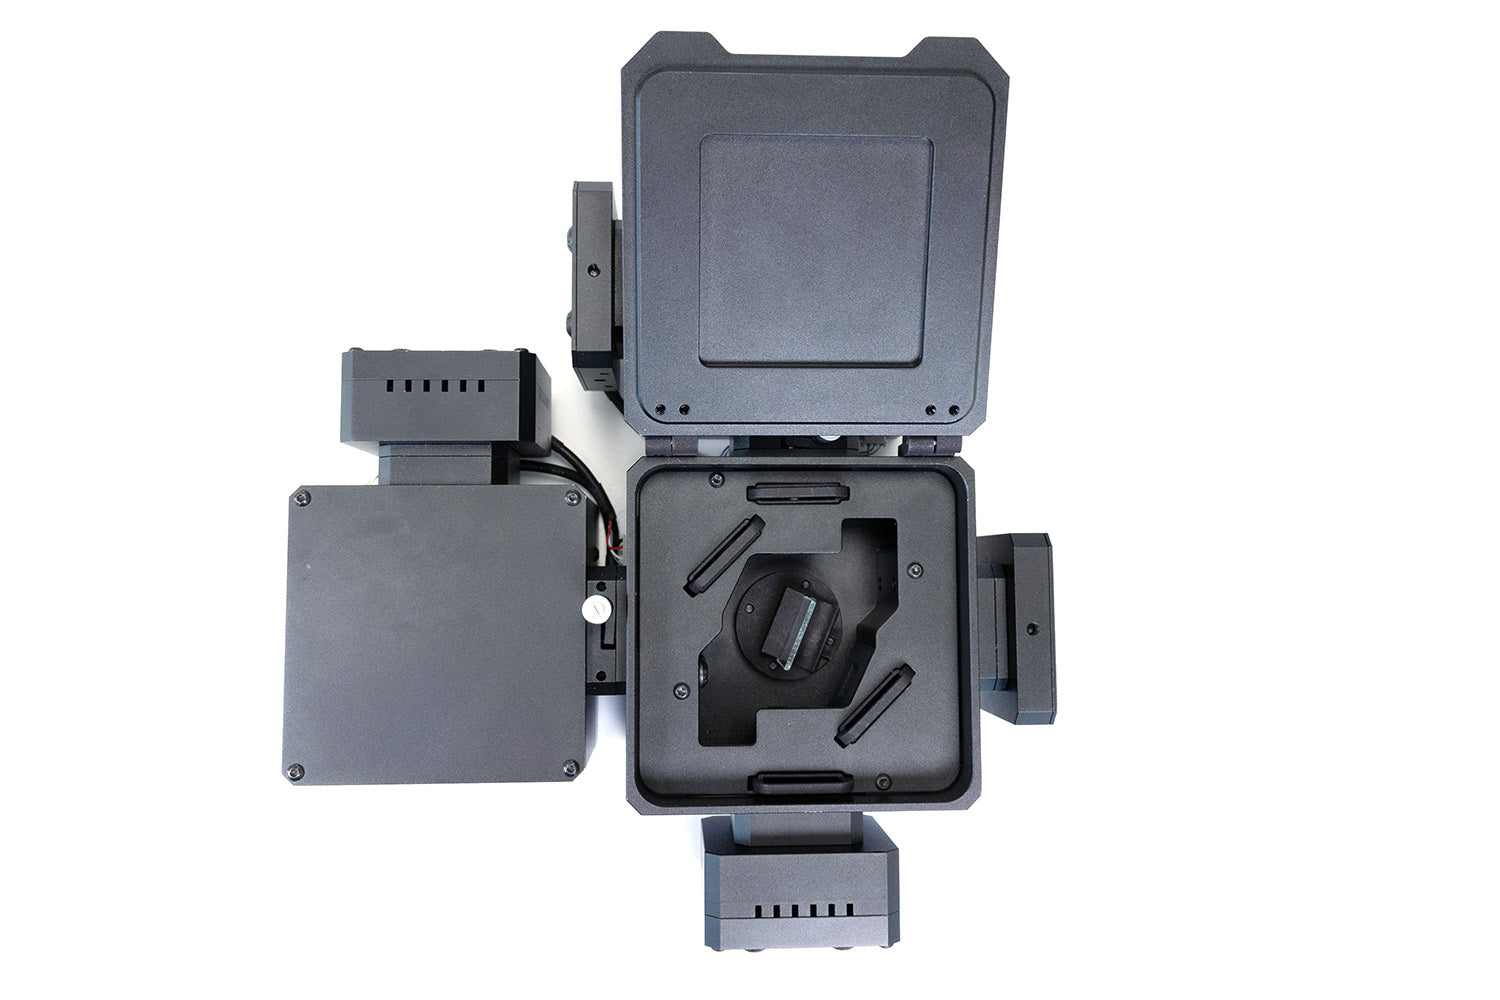
The Ossila spectrofluorometer has a sample holder in which you can vary the measurement angle. By angling the edge of your thin film sample towards the detector you can take advantage of the channelling of emitted lights towards the edges of the film. This will be where the most signal can be taken from.
However, if using a modular spectrometer set-up then positioning of each component will play an important part in accurate fluroescence measurements. The following graph shows a fluorescence spectra measured using the Ossila USB Spectrometer. It shows fluorescence from PFO (F8) films and deposited on quartz substrates.

Here, we varied the angles between the incident and measured light using the Ossila UV light source (which is included with the Ossila Optical Spectroscopy Kit) and the Ossila 4-port Spectroscopy Transmission Holder. We also used optical fibers between each element to increase the signal-to-noise ratio. You can see from this graph that the measured spectrum is substantially different at each angle. All these spectra have the same measurement variables in order to make them comparable.

The first measurement angle that we tried was at 180° and it was taken straight through the sample as you would do for absorbance measurements. However, you can see in the spectral graphs that any fluorescence signal at this angle was swamped by the excitation source (at 360 nm). This explains the big signal seen at 360 nm. You can see a small amount of fluorescence in the inset figure. To attempt to resolve this, we increased the integration time of the measurement; however, we quickly received the "Intensity Signal Threshold Reached" error message. If you measure samples at this angle, the intensity threshold must be low in order to avoid this error.

In order to negate the transmission of the excitation signal, we tried taking a measurement at a 90° angle to the excitation source. This method can be successful in reducing the excitation signal, but your measurement will still be swamped. At this angle, we found that there was a large amount of specular reflection due to reflection off the quartz substrate (you can see some fluorescence on the graph when you zoom in). However, as in the case of the 180° arrangement, the integration time you can use is limited by an intensity warning.

We found that the ideal angle for taking fluorescence measurements was at 45° from the excitation source. Here, there was a minimal amount of reflection, and due to the low levels of excitation signal, we could increase the integration time to get a higher signal intensity and more accurately measure PFO fluorescence. You can notice all of this on the graph above.
The graph below shows the optimized fluorescence measurements as taken using the Ossila Optical Spectrometer, optical fibers, 4-port spectroscopy sample holder and UV light source.

Longpass Filters
One way that you can omit the excitation signal is to use broadband filters. Using these filters allows you maximize the fluorescence signal without flooding the detector with the incident light source. Longpass filters (or long pass edge filters) only transmit light above a certain wavelength. Therefore, you must select a filter that removes your excitation source (as completely as possible) while transmitting your measurement signal. .
Some fluorescence spectroscopy systems, like the Ossila Spectrofluorometer, have slots for filter placement. The placement of filters in any spectroscopy set-up will have different effects on measurement.
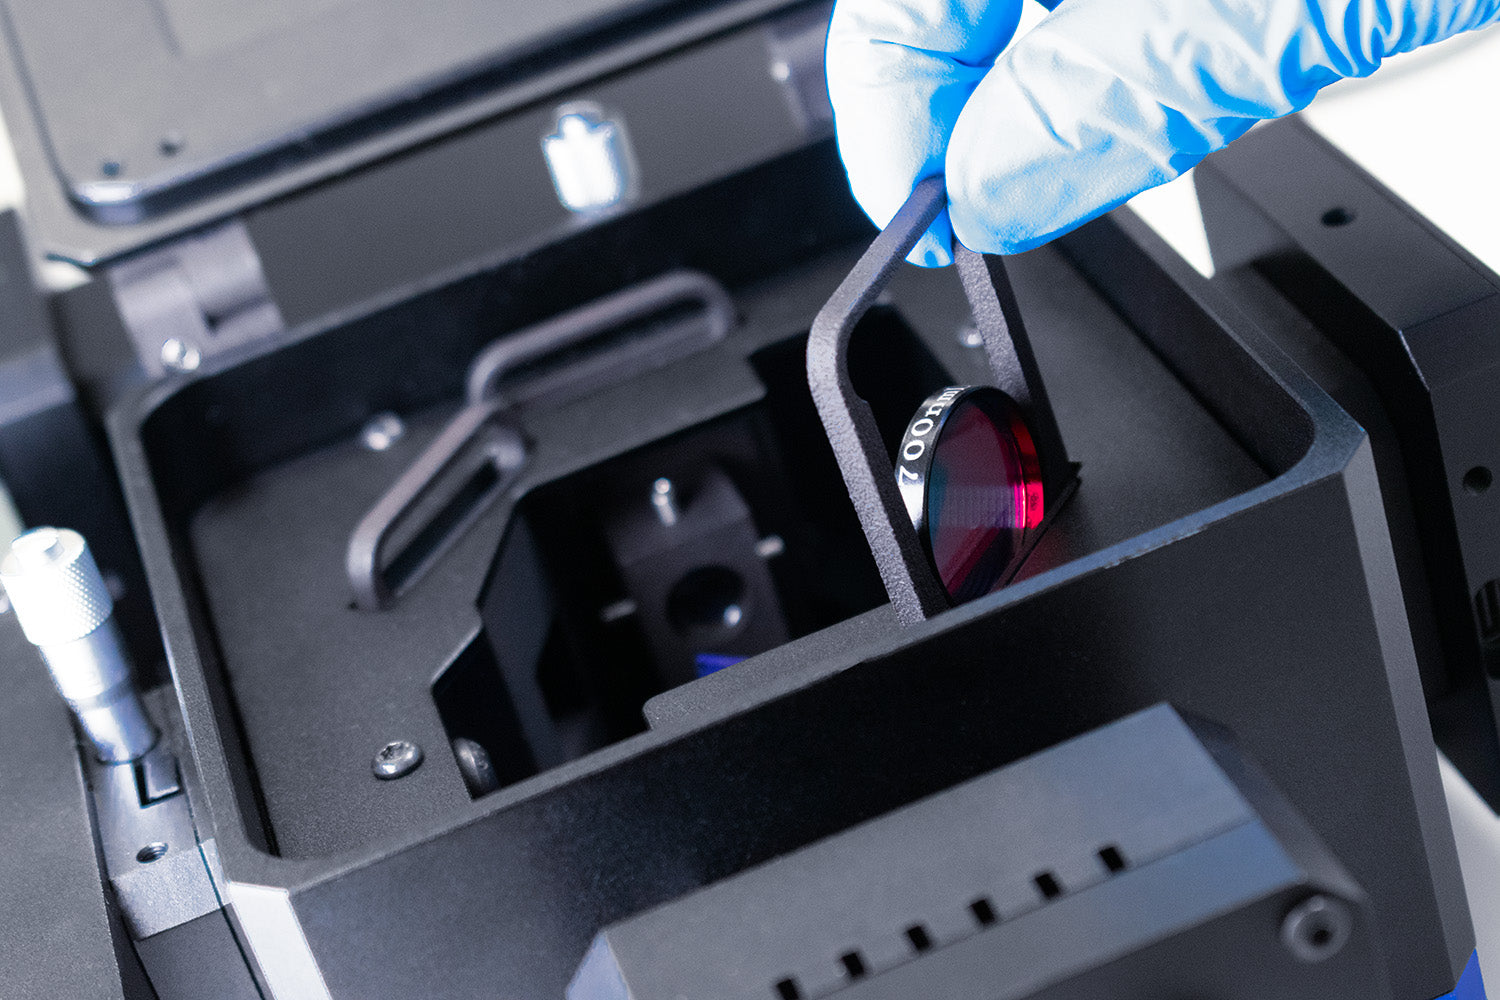
In the Ossila Spectrofluorometer:
- Placing a filter between the sample and the detector reduces or block unwanted signals, such as the excitation signal. This is vital for measurements like fluorescence, where a strong excitation signal is required, but the emission signal is comparatively low.
- Additionally, placing a filter between the light source and sample can help reduce the impact of second order effects if using the tunable light source. The diffraction grating in the monochromator diffracts light dependent on its wavelength, but also on diffraction order. This is more of an important factor in absorbance measurement but should be considered with fluorescence.
If using a modular spectrometer, filters can be positioned between the sample holder and spectrometer components.

For some samples, the use of filters may present a problem. For example, we decided to use a 495 nm long pass filter to remove all traces of the excitation source when we took PL measurements of PFO at a 180° angle. This was successful in blocking the excitation signal; however, several of the PFO peaks (at 430 nm and 460 nm) were below this angle and so were cut off from the measurement. For each sample, it is important that you consider the excitation wavelength to avoid this effect.

USB Spectrometer
Learn More
 Thin Film Spectroscopy: Setup and Measurement
You can use your optical spectrometer to measure the absorbance and transmission of visible light through thin films. You can also measure other properties of thin films using this technique, such as photoluminescence. The Ossila Optical Spectroscopy Kit comes with everything you need in order to conduct these measurements on thin films. This article contains some advice from our researchers that should help you get started taking optical spectroscopy measurements of thin films.
Read more... Choosing A Light Source For Your Spectrometer
Depending on your spectrometer application, you will probably need at least one illumination or excitation source. For electroluminescence measurements will require of some sort of testing board connected to an external voltage source. However, most characterization of optical materials require some sort of incident light. The light source you will need depends on the measurements you are doing.
Read more...