Thin Film Spectroscopy: Setup and Measurement
You can use your optical spectrometer, like the Ossila USB Spectrometer, to measure the absorbance and transmission of visible light through thin films. You can also measure other properties of thin films using this technique, such as photoluminescence. Our USB Spectrometer Kit comes with everything you need in order to conduct these measurements on thin films. This article contains some advice from our researchers that should help you get started taking optical spectroscopy measurements of thin films.
Fabricating your Samples
For optical spectroscopy experiments, we recommend depositing your sample on a quartz substrate. Quartz-coated glass is ultra-smooth, and it is not absorbent in the visible light region, so it shouldn't interfere with the optical or morphological properties of your device.
It is important that you try to reduce the number of defects and pinholes in your film where you can. This is because defects can have different optical properties from the bulk material, and this will affect your results. If you are depositing your film from solutions, you may wish to heat, agitate, or filter your solution before coating your substrate. This will break up or remove any aggregates or impurities.
Additionally, it is also important to ensure that your substrates are clean before you coat them. To assure that your substrates are clean, we recommend that you rinse and sonicate them in a substrate rack in several solutions (Hellmanex, DI water, IPA, acetone), using a pressurized gas flow to dry them between each solution. Next, expose your substrates to a UV ozone cleaner for several minutes before coating to increase their wettability.
Good news though - your sample doesn't have to be completely perfect for you to take an optical spectroscopy measurement. Actually, only a small area of your sample will be in the beam path, so try to make sure that you position a "nice" uniform area of your sample here. The Ossila USB Spectrometer will focus the light into a small area of 1.6 mm - 1.8 mm diameter. The approximate placement of this beam on a 15 mm x 20 mm substrate (placed in vertically) is shown in the diagram below.

If you are taking absorbance measurements from particularly thick or dark films, they may not transmit enough light through for you to get an accurate absorbance measurement. Instead, your measurement may have a low peak intensity and a lot of noise. In this case, you may need to dilute your precursor solution more before creating a thin film.
Taking a Measurement
The Ossila spectrometer comes with its own software that makes taking a spectroscopy measurement as easy as possible.
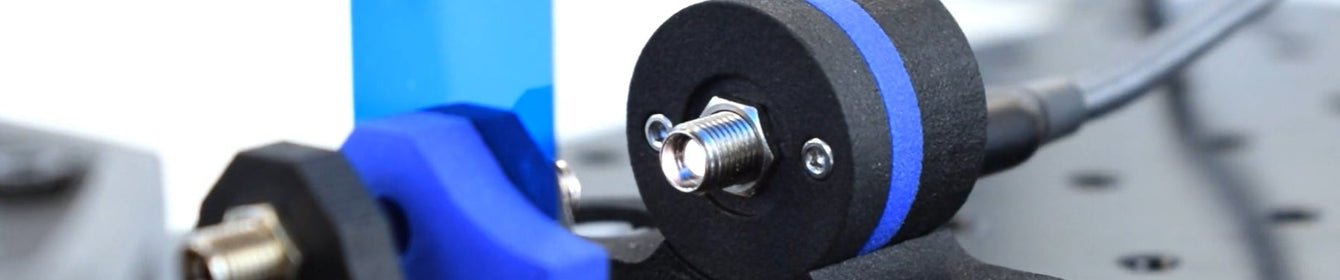
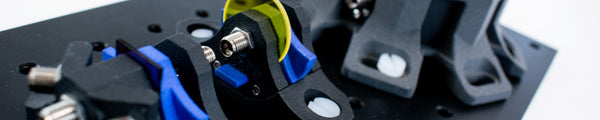
Before you begin, you need to decide if you want to use optical fiber cables or measure your sample directly through air. If you measure the light directly, make sure that all of your equipment is aligned using the optical breadboard, and do not move the components relative to one another once you take your first measurement.
There are different optimum set-ups for each of these relative various components. The ideal set-up for you is going to depend on both your sample and on which measurement you want to take. For strongly fluorescent samples, we recommend a 45° angle between the incident light and the output measurement. You can set this up using our 4-port transmission sample holder.

If you are measuring absorbance and transmission, your input light source and your output measurement beam must be parallel. This is the only way that you will be able to measure the direct transmission through your sample.

Additionally, for absorbance and transmission measurements, you must take a reference spectrum through a blank quartz film. If you change anything during your experiment, you must retake this reference measurement. This is because, for both transmission and absorbance spectroscopy, you are comparing the light traveling through your sample to this reference measurement. If any variables (such as integration time) change between measurements, the absorbance units can become un-physical.
USB Spectrometer
Measurement Variables
Within the Ossila Optical Spectrometer software, there are some variables which you can change to optimize your measurements.
Integration Time
Integration time dictates how long your spectrometer will collect photons before it begins to process this data. With a smaller integration time, you will receive a short snapshot of the optical properties of the material. This is useful if your material has a very strong optical signal, as it allows you to measure the optical properties of your sample without flooding the intensity threshold of the spectrometer.
In most cases, by increasing the integration time, you will increase the number of photons collected from your sample. This will improve your signal-to-noise ratio and increase the intensity of your peaks.

The above figure shows how the fluorescence intensity of PFO increases as the integration time increases. It also shows how, if this integration time is too long, the measured signal will exceed the limits of the spectrometer. Here, Integration Time = 1000 ms and the fluorescence peaks at 430 nm - 450 nm are cut off. If this occurs with your measurements, you will get a warning saying, "Spectral intensity maximum exceeded".
If you change the integration time when you take absorbance measurements, you must retake the background and reference spectra. This is because the absorbance units will be proportional to the light intensity measured through your sample at each wavelength, divided by the intensity measured through your reference sample at that wavelength.

So, if you only increase the integration time for your current measurement, the spectrometer will collect a larger amount of light than it did for the reference measurement. You then won't be able to compare the reference measurement to your sample measurement as you will have changed the quantity of your measured light.
Another effect of having different integration times for your reference measurement and your sample measurement is that the absorbance spectra may fall below zero. At a specific wavelength, if I ≥ I0, then absorbance falls below zero. This doesn't make physical sense, as it suggests that the sample is producing light, which most absorbent materials do not do under broadband light. At the wavelengths where light is transmitted through your sample, the spectrometer will collect more light for the experimental measurement than it collected for the reference sample. This is due to the different integration times and will result in inaccurate absorbance values on the y-axis. You can still use peak shape and placement using this data, but it will need to be normalised between 0 and 1. Using this data, you cannot extract an absorption coefficient.
Delay
The delay setting allows you to set up a delay between successive measurements. This might allow samples to "recover" between measurements and it can be useful if you are using materials that are sensitive to illumination. Using the delay setting will also ensure that luminescence from your previous measurements isn't included in your subsequent measurements.
Accumulation
If you change the accumulation number on your spectrometer, you will get a sum of multiple different spectra. For example, if you set it to five when you take a measurement, the Ossila software will take five individual successive spectra and add these up. This will give you a spectrum with five times the signal intensity of your initial measurement and will help reduce noise. This can be especially useful if you have low amounts of fluorescence or signal.
Averaging
If you change the averaging number on your spectrometer, you will get an average of multiple different spectra. If you set it to five when you take a measurement, the Ossila software will output an average of five different individual spectra. This means that your spectrum will be smoother.


For both fluorescence and absorbance measurements, increasing the number of individual spectra that you average should increase the smoothness of your graph. For strong signals, such as PFO fluorescence, you only need to average over a few spectra as the signal is already quite strong. However, for measurements where there are low levels of light detection, such as absorbance measurements of P3HT:o-IDTBR films, averaging over many spectra can help to significantly increase the signal-to-noise ratio.
USB Spectrometer
Learn More
 Absorbance Measurement
Absorbance measurements are crucial in many areas of scientific research. This article describes how to take an absorbance measurement using an optical spectrometer.
Read more... Fluorescence Spectroscopy
Fluorescence spectroscopy is used to measure fluorescence. The technique often used together with absorbance spectroscopy. Fluorescence is a type of photoluminescence where light is quickly reemitted from a material after incident photons are absorbed. This is different to phosphorescence where there is a delay between photon absorption and emission. The term fluorescence is often used interchangeably with photoluminescence.
Read more...