


Spectrophotometry
Spectrophotometry vs. Spectroscopy | How Does Spectrophotometry Work? | Absorption and Fluorescence Spectrophotometry
How to Use A Spectrophotometer | Instrument Design | Spectrophotometry Applications | Instrument Limitations | More Resources

Spectrophotometry examines the interactions between visible light and matter through measurements like absorbance, transmission and reflectance spectroscopy.
A spectrophotometer is a piece of spectroscopy equipment measures the amount of light absorbed by a sample. Some wavelengths of light will be more strongly absorbed by the sample than others, and this information can reveal its molecular structure. This measurement can be useful in many research applications:
- To identify materials by mapping molecular absorption profiles.
- To work out solute concentrations in solutions.
- For detecting trace impurities in samples
- Following the progress of chemical reactions.
By measuring the light intensity transmitted at each individual wavelength, a spectrophotometer builds an absorbance spectrum.
Spectrophotometry vs. Spectroscopy
The terms spectrophotometry and spectroscopy are often used interchangeably. However, there is a subtle difference between them.
| Spectrophotometry |
The study of interaction between light and matter, often measuring transmission or reflection as a function of excitation wavelength. These measurements are usually taken with spectrophotometers. |
|---|---|
| Spectroscopy |
The study of an interaction between radiative energy and matter. This includes techniques that measure light energy (e.g. optical spectroscopy, infrared spectroscopy and Raman spectroscopy) or those that evaluate the energy of charged particles (e.g. mass spectroscopy, radiation detection). |

Spectrophotometer vs. Spectrometer
Like spectroscopy and spectrophotometry, these terms are often used interchangeably but have slightly different definitions.
A spectrometer is the general term for a piece of equipment that can separate and measure spectral components of a physical phenomenon. Spectrometers can measure various phenomena such as electromagnetic light, mass, or nuclear magnetic resonance. This encompasses many tools including mass spectrometers, NMR spectrometers and spectrophotometers.
A spectrophotometer is an instrument used for spectrophotometry measurements. This include for absorbance, fluorescence and transmission spectroscopy.
In optical spectroscopy, spectrophotometers and spectrometers differ in design and ideal applications. Spectrophotometers are commonly associated with biological, life science and chemistry measurements, whereas spectrometer is the general term used in physical sciences.
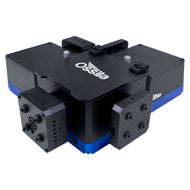
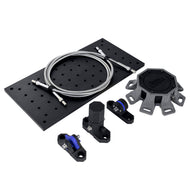
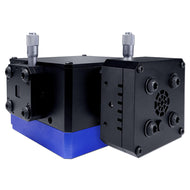
Browse Spectrophotometry Equipment

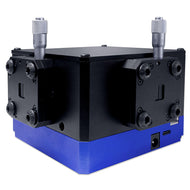
How Does Spectrophotometry Work?
Spectrophotometry relies on the use of spectrophotometers, which are analytical instruments that measures intensity of light against wavelength, after it's transmitted through a sample. The four most important components of these instruments are:
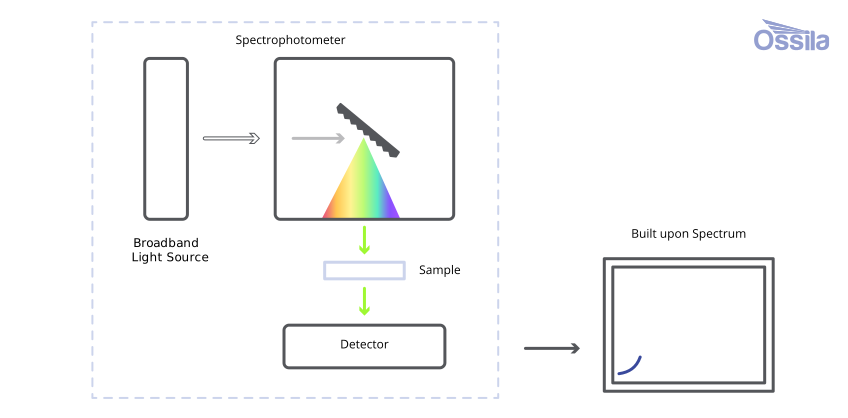
- A light source
- A monochromator
- A sample holder
- A detector
Spectrophotometry measurements follow this general process:
- Light from a broadband light source is dispersed by the diffraction grating in a monochromator.
- The monochromator transmits a narrow band of wavelengths into the sample chamber.
- This section of dispersed light travels towards a detector, passing through the sample.
- The diffraction grating rotates, allowing the monochromator to select or scan through different wavelengths.
- The detector measures intensity at each wavelength, building an absorbance spectrum.
This wavelength-by-wavelength approach means spectrophotometers can measure smaller signals with higher accuracy and resolution compared with modular, array-based spectrometers.
The four essential components must be carefully considered to build a spectrophotometry system:
-
The Light Source
Absorbance and transmission measurements require a broadband (white) light source e.g. halogen bulb, arc lamp or an LED light source. For standard absorbance measurements, this light source needs to have a significant output across at least the visible light spectrum (380 - 780 nm).
However, spectrophotometers differ from spectrometers as they split broadband light into component wavelengths before measurement, while spectrometers use CCD arrays to measure across the wavelength range entire wavelength range at once. USB spectrometers provide a fast measurement, but its measurement precision and sensitivity is limited.
Therefore, spectrophotometry instruments often use a strong broadband light source in combination with a monochromator, to create a tunable light source. The sample is only exposed to a small portion of light at a time, and the rotating diffraction grating within the monochromator allows users to choose this excitation wavelength. Combining a variable light source with a single pixel detector, these systems can measure low signals with higher accuracy and resolution compared to spectrometers.

The Ossila Tunable Light Source, is used in the spectrophotometer Alternative to this, you can use a monochromatic light source (i.e. a laser), but you will only be able to measure absorption at a specific wavelength. This is suitable for some absorbance measurements such as OD600 measurements used in microbiological studies.
-
A Sample Chamber
The placement and alignment of your sample within a spectrophotometer is important. The sample chamber is designed to ensure that sample positioning is consistent between experiments, improving reliability and repeatability. These systems often have specific sample holders for different materials e.g. for a thin film or an optical cuvette. These can also include attachments for filters to tailor and adapt measurements.
-
Light Intensity Detector
Once light has passed through the sample, its intensity needs to be quantified, using a photodetector. This photodetector will convert incident light into an electrical signal proportional to the incident light intensity. There are several types of photodetectors, suitable for different wavelengths and/or intensities of light. Silicon-based detectors are a common choice for visible light measurements. Additional electronics are also required to turn the signal from the photodetector into a meaningful number.
To improve accuracy and sensitivity, spectrophotometers use a single pixel detector. These have a greater measurement area that other alternatives, such as CCD arrays used in spectrometers, allowing them to measure lower signal changes improving sensitivity. However, they cannot distinguish between different wavelengths of light. This is why single pixel detectors must be combined with a monochromator, to separate light before measurement.
-
Monochromators
The light from the sample needs to be split into its component wavelengths as the detectors cannot distinguish between different wavelengths. This dispersion is achieved using a monochromator, which consists of an entrance slit, a diffraction grating (or less commonly a prism) and focussing mirrors. The diffraction grating disperses light, and rotates to direct a different portion of the spectrum towards an exit slit. This mechanism allows you to vary the output wavelength easily and reliably.
Absorption and Fluorescence Spectrophotometry
Spectrophotometry investigates how light interacts with matter through measurements like transmittance, absorbance, or reflectance spectroscopy. Some spectrophotometry instruments (often called spectrofluorometers) can also perform fluorescence measurements. However, this often requires the use of a second monochromator.
Absorbance
Absorption spectroscopy measures the attenuation of light as it passes through a material. As light travels through a substance, photons of high enough energy can be absorbed by electrons, transferring them into higher energy states. In most optically active materials, UV and visible photons can promote electrons to higher energy electronic orbitals, while IR photons can increase the vibrational energy of electrons.
Absorbance is measured on a logarithmic scale, representing the ratio of incident light intensity (I0) to transmitted light intensity (I) as it passes through a sample:

Absorbance measurements rely on the Beer-Lambert Law, relating the light absorbed by a sample to an absorbance coefficient, concentration and the path length of the light. There are multiple ways to define absorbance, one of which is described with Beer-Lambert law

Where:
- ε is the molar absorptivity (an absorbance constant for a given substance at a given wavelength)
- c is the concentration of the absorbing species
- l is the path length of the sample (usually the width of a cuvette)
Absorbance measurements are wavelength dependent. Molecules will absorb specific wavelengths of light based on their electronic structure. Therefore, a material’s absorbance spectrum serves as a molecular fingerprint, allowing for both qualitative identification and quantitative analysis of compounds. This technique can track changes in systems or materials in a non-invasive manner (i.e. phase changes, glass transitions in polymers, or changes in pH).
Transmittance
Transmittance and transmission spectroscopy simply measures transmission of light through a sample. The transmittance, T, of a sample is defined as the ratio of light incident on the sample, I0 , to the intensity of light emerging from the other side of the sample, I:

Transmission measurements are related to absorbance measurements via this relationship.

Assuming no reflectance or other optical losses. Transmittance spectroscopy is used to measure the optical transparency of materials. This is necessary for many coatings and thin films. For example, in the case of optoelectronic devices, the top contacts and top facing transport layers need to be transparent across visible wavelengths.
Fluorescence Spectroscopy
Fluorescence spectroscopy, also known as photoluminescence spectroscopy, measures radiative emission from a sample. A sample or material absorbs electromagnetic energy in the form of a photon, then re-emits this energy as another, lower-energy photon.
There are two main types of photoluminescence: fluorescence and phosphorescence. Unlike chemiluminescence or electroluminescence, photoluminescence requires the absorbance of a photon.
Fluorescence measurements are often used alongside absorbance measurements to further understand a molecule's electronic configuration. Absorption is sensitive to the ground state of a molecule, but fluorescence is sensitive to it's excited states. Fluorescence measurements are also more useful for detecting trace impurities in samples.
Fluorescence spectroscopy instruments require a few additional components, compared to those used for just absorbance and transmission measurements:
- Photoluminescence occurs isotropically. Fluorescence can be measured at many angles but the signal intensity at any specific angle is likely to be low. Therefore, these fluorescence systems require optimized configurations to maximize signal intensity while reducing reflection effects and other noise.
- Photoluminescence measurements require a specific excitation source, usually a high-energy light source. The most used sources are UV lasers or other monochromatic light sources.
- Fluorescence measurements require a second monochromator between the sample and the detector to measure the emission spectrum. This also limits stray light, and helps omits the excitation wavelength.
- Often, calibrated spectrofluorometers are the best tools for taking fluorescence and phosphorescence measurements.
Fluorescence vs Phosphorescence
Fluorescence spectroscopy involves the relaxation of an electron through a singlet-singlet transition and happens on a nanosecond timescale. This means that once an electron has absorbed a photon, it almost immediately relaxes and re-emits another, lower-energy photon. This short lifetime means that fluorescence emission occurs only while the sample is being illuminated.
Phosphorescence occurs over a longer time scale. Phosphorescence requires a triplet-singlet transition, which is much less likely to occur than a singlet-singlet transition. The longer lifetime of phosphorescence means that phosphorescent materials emit light use to several minutes after being illuminated. Therefore, these materials glow.
How to Use A Spectrophotometer
Spectrophotometry is a reliable and accessible way to characterize optical properties from a thin film or of a species in solution. When done correctly, UV-Vis (or optical) spectroscopy can be a powerful technique which can reveal intricate details about the molecular structure and optical properties of a sample.
When setting up a spectrophotometry lab, you will need to choose between a modular spectrometer system or an appropriate spectrophotometry instrument:
- For a modular spectrometer lab, you will need:
- An optical spectrometer
- A fixed sample holder
- A high-energy light source (for fluorescence measurements)
- A broadband light source (for absorbance/transmission measurements)
- A breadboard
- Optical fiber cables between modular elements to reduce signal attenuation
- A spectrophotometry unit
- Spectrophotometer - consisting of a single monochromator, capable of doing absorbance and transmission measurements
- Spectrofluorometer - consisting of two monochromators, one for selecting excitation wavelength, and one to select emission/transmission wavelength. Capable of measuring fluorescence, absorbance and transmission measurements.
How To Take Absorption Measurement
To measure absorbance using the Ossila Spectrophotometer:
- Open the Ossila Spectrophotometry software on the Absorption tab.
- To measure an absorbance spectrum, start by defining start wavelength, end wavelength and wavelength step.
- Take a reference spectrum with no sample in place. This will appear as a dotted line (axis right).
- You can adjust light power and slit width to maximize the reference response.
- Once happy with the reference, select it as the reference spectra.
- Place your sample in the dedicated sample holder and start the absorbance measurement.
- Measured data appears as a solid line, with absorbance axis on the left.
Transmission Spectroscopy Using a Spectrophotometer
To measure transmittance, you simply pass light from a broadband light source through a sample and measure the resulting intensity compared to a background or reference spectrum. This can also be easily measured with the Ossila Spectrophotometer or Spectrofluorometer.
- Open the Ossila Spectrophotometry software on the Transmission tab.
- To measure a transmission spectrum, start by defining start wavelength, end wavelength, wavelength step and other parameters.
- Take a reference spectrum with no sample or a reference sample in place. This will appear as a dotted line (axis right).
- Once happy with the measurement parameters, select this as the reference spectrum.
- Place your sample in the dedicated sample holder and start the transmission measurement.
- Measured data appears as a solid line, with axis on the left.
UV-Vis Sample Preparation
Without well prepared samples, the results can be not only challenging to interpret but also potentially deceptive.
Quartz substrates or cuvettes are good substrates for optical spectroscopy. Quartz-coated glass is ultra-smooth, and not absorbent in the visible light region, so shouldn't interfere with the optical or morphological properties of your device.
Ensure your substrates are clean before coating. Contamination can lead to inconsistencies in spectrophotometry measurements. In solution, dust or particulates can scatter light. In thin film samples, defects will have different optical properties from the bulk film material.
To assure that substrates or cuvettes are clean, we recommend rinsing and sonicating them, in a substrate rack, in multiple solution baths (Hellmanex, DI water, IPA, acetone). Then use a pressurized gas flow to dry them between each solution.
For thin films, UV Ozone treatment can increase surface wettability improving coating coverage. If you are depositing your film from solutions, you can heat, agitate, or filter your solution before coating your substrate to break up any aggregates.
While your sample doesn't have to be completely perfect, it is important that a good section of your sample is within the beam’s path. Therefore, you should make your sample as uniform as possible.
Solution concentration or film thickness can impact the quality of your spectrophotometry measurement significantly. If you are measuring thick, dark films or a highly concentrated solution, light transmission will be low, increasing impact of noise. In this case, you can create a thinner film or a less concentrated solution.
Thin Film vs. Solution Measurement
As a sample moves from a liquid solution to a solid thin film, its optical properties will change. In a solution, particles are kept isolated, especially at low concentrations, so you are measuring the optical properties of the monomer alone. However, the formation of thin films involves processes that might present different optical effects.
The material properties change during film formation, as the film is being spin coated or during any annealing steps. For these reasons, it is often useful to be able to conduct UV-Vis measurements on both solutions and solid thin films.
With the Ossila Spectrophotometer, you can easily switch between solution-based measurements and measuring thin films.
Solutions
It is often easiest to measure the optical properties of a sample in solution. In most spectrophotometry labs, optical measurements are taken within a standard quartz cuvette. This is a straightforward way to confine your material within a controlled environment of known path length.
Alternatively, some biological experiments, such as spectrophotometric assays, measure their samples in well-plates to reduce the amount of solution needed and to measure across many concentrations simultaneously.
Most cuvettes have a standard size. However, they can have varying path lengths, varying window transmission wavelengths and different window orientations. You should find a cuvette suitable to your spectrophotometry measurement.

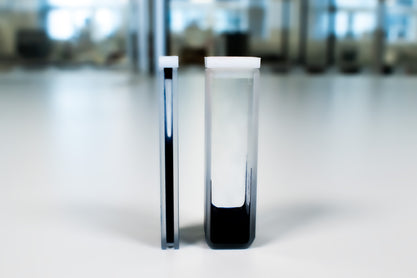
To prepare your samples for solution-state spectrophotometry measurements, you should consider the following points:
- Ensure that your cuvettes are as clean as possible. If you can, put them through a standard glass washing procedure. At the very least, they should be rinsed with the last used solvent and a rinsing agent, such as acetone, deionized water or IPA.
- Before loading your sample, rinse cuvettes with the solvent that your sample is dissolved in to remove residual solvents left over from cleaning.
- Use a cuvette filled with the diluting solvent as the reference measurement, i.e. for absorbance spectroscopy. This will ensure that your measurement will account for any optical effects introduced by the quartz cuvette or the solvent.
- Choose an appropriate sample concentration.
- Optimize the path length for your experiment. Using a cuvette with a smaller path length can be useful if you cannot reduce your sample concentration without altering your measurement. Smaller path length also reduces the volume of sample needed. This can be especially useful if you have a small amount of sample or if your material is expensive.
- Always ensure that your samples are completely dissolved in your chosen solvent. Wherever possible, filter solutions before using to remove contaminants.
Thin Films
There are some situations where it is more suitable to measure your samples as thin films. For example, if measuring the properties of layers in a device or coatings on a surface. Studying thin films better represents the materials performance in their given applications.

To prepare a thin film for UV-Vis spectroscopy:
- Ensure your thin film is an appropriate thickness. Like concentration for solution samples, varying film thickness will affect your measurements. If spin coating, film thickness can be changed by varying spin speed or precursor concentration.
- When preparing your sample, try and make your films as smooth and uniform as possible. Any defects, pinholes or inconsistencies in your film can affect your spectroscopy measurements.
- You should prepare the film so that the sample covers most of the substrate surface evenly. This will make it much easier to conduct your measurement.
Measurement Tips
- If using a modular spectrometer, align components on a breadboard or use optical fibers to direct the signal. If measuring the light directly (without optical fibers), make sure the components are fixed relative to one another.
- For absorbance and transmission measurements, you must take a reference spectrum through a blank quartz substrate or cuvette filled with solvent.
- If you change anything during an experiment, retake this reference measurement. This is because, for both transmission and absorbance spectroscopy, you are comparing the light traveling through your sample to this reference measurement.
- When measuring fluorescence from thin films, it is important to account for any light reflection - especially if you are using a specular substrate such as smooth glass. This can be considered when choosing your measurement angle.
Optimizing Measurement Variables
Wavelength Range
As spectrophotometry systems usually use a monochromator to select illumination wavelengths, second order effects can impact your measurement. Second order effects occur where a monochromator’s output wavelength is double the wavelength also produced by the light source. For example, if a monochromator can output at 400 nm and 800 nm, when the output is set to 800 nm, there will be second order effects from the 400 nm dispersed light. In these situations, both signals from the 800 nm (first order) light and the 400 nm second order light will be combined in the output. However, the second order 400 nm signal will be at a lower power than when the monochromator is selecting the 400 nm (first order) signal.
To avoid second order effects, you need to select a wavelength range that does not cover any wavelengths that are double any other wavelengths in the range. For example, to measure the absorbance between 380 nm and 1000 nm, you would need to do two measurements: the first between 380 nm and 750 nm and the second measurement between 750 nm and 1000 nm.
Additionally, if measurements do overlap into the second order, a filter should be used to prevent the second order light from illuminating the sample. In the previous example, a 750 nm long pass filter can be used to illuminate second order signals.
Wavelength Step
The wavelength step determines the resolution of the measurement. The smaller the wavelength step, the more detailed the measurement but the longer it will take.
Delays Between Measurements
A delay setting allows you to define a delay time between switching to a new wavelength and taking a measurement. This can help when performing measurements of samples that react slowly to changing illumination. Determining a delay time might also ensure that signals from previous measurements aren’t included in your subsequent measurements.
Signal Accumulation
Some spectrophotometers have accumulation functions, which take several independent measurements and sum the values to increase signal intensity.
In these systems, the spectrophotometer software takes several measurements and accumulates the intensity values at each wavelength. Any noise will not be consistent between measurements. This means that only the peaks are amplified and the signal-to-noise ratio increases. This can be especially useful if you have low signal intensity. However, this will significantly increase measurement time, especially if measuring an entire spectrum.
Averaging Measurements
Averaging is similar to accumulation, but instead of summing the measurements, the mean is calculated. This creates a smoother graph and increases the signal-to-noise ratio.
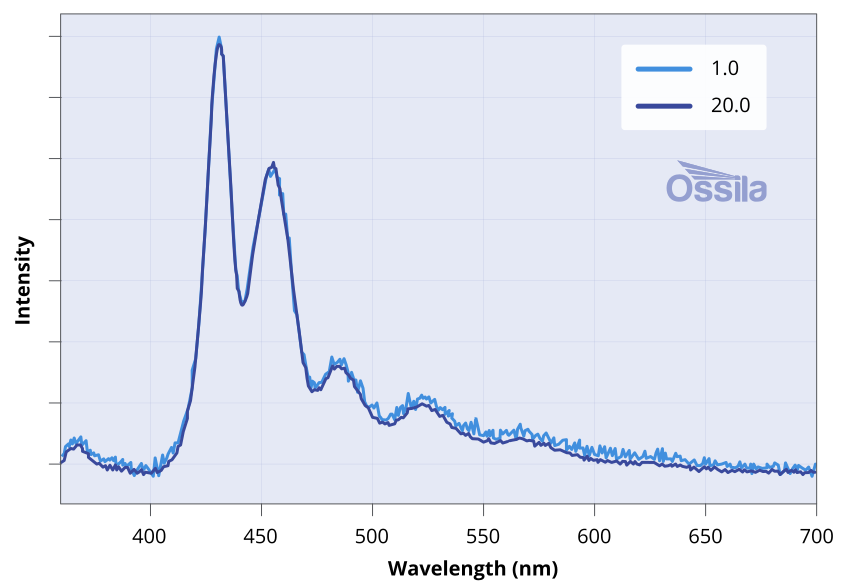
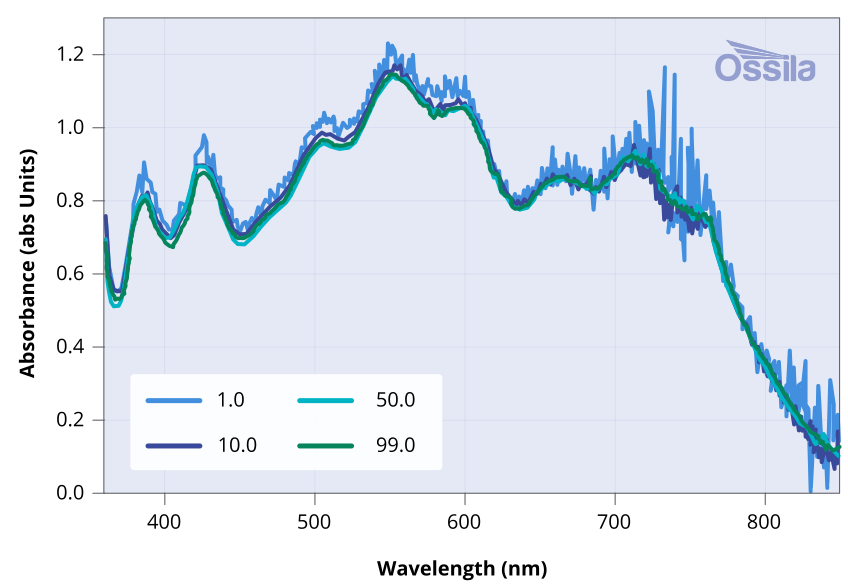
This can be especially important for measurements where there are low levels of light detection, such as absorbance measurements of P3HT:o-IDTBR films, averaging over many spectra can help to significantly increase the signal-to-noise ratio.
Accumulation and averaging can be used together to both increase the signal and reduce the impact of noise. In such cases the signal is accumulated for each measurement used in an averaged data point. Therefore, use of both will significantly increase the measurement time.
Light Power
The power of the illumination source will affect the intensity of the measured signal: the higher the illumination power, the higher the signal. However, if set too high it can result in the detector saturating, removing details from the measurement. Generally, for absorption and transmission measurements, the more transparent the sample, the lower the power will want to be.
Instrument Design
Single vs. Double Beam Instruments
Spectrophotometers can be classified into two main configurations: single beam and double beam instruments. In a single beam configuration, light passes through only one path, so reference and sample cells must be measured sequentially. Double beam systems split the light into two separate paths, allowing measurement of the reference and sample simultaneously. This dual-path design makes double beam instruments more reliable, as they can account for any short-term variations in the light source intensity during measurement. However, this improved accuracy comes at the cost of increased complexity, making double beam systems more difficult to configure and typically more expensive than their single beam counterparts.
Resolving Power and Signal-to-Noise Ratio
Resolving power defines a spectroscopy system's ability to distinguish two closely-spaced spectral peaks as separate features. To characterize this, the instrument measures the spectrum of a monochromatic light source (such as a mercury or neon emission line). The full width at half maximum (FWHM) of the measured peak represents the instrument's spectral resolution. A narrower FWHM indicates better resolving power, meaning the system can distinguish peaks separated by smaller wavelength differences.


Where, Δλ is the FWHM of a line source and λ is the wavelength at which the measurement was taken.
An instrument's sensitivity is usually quantified by its signal to noise ratio. This is the ratio of signal intensity to noise from unwanted sources.

Where Sm is the maximum intensity of the signal and Nrms is the root mean square of the background noise.
There are multiple components within a spectrophotometer that will contribute to the overall systems resolving power and measurement sensitivity. However, optimizing one often comes at the expense of the other. It is therefore a balancing act to ensure both resolving power and signal-to-noise values are maximized within the given wavelength range.
- If the monochromator uses a blazed diffraction grating, the light will be diffracted with the greatest efficiency (at the desired diffraction order) at the grating blaze wavelength. Therefore, the instrument will have high sensitivity to signals at this wavelength, with sensitivity decreasing at wavelengths further from the blaze peak. Diffraction gratings should be chosen carefully to optimize light separation within the visible wavelength range. Diffraction groove density also impacts the balance of signal intensity to resolving power. Increased groove density increases dispersion angle, which improves wavelength accuracy, but limits transmitted signal intensity.
- In systems using a rotating diffraction grating, a monochromators ability to select a specific wavelength depends partially on the step size of the turning motor used. This affects wavelength selection accuracy and therefore resolving power.
- Adjustable slits give users the ability to tune both spectral resolution and signal intensity. For example, increasing the exit slit width from the monochromator will increase signal intensity as more light is passed through the sample into the detector. However, this reduces the resolving power of a monochromator, as a larger range of wavelengths are allowed through.
- The other major component that will affect instrument resolution and sensitivity is the detector. Most spectrophotometers use a single pixel detector which collects signals over a larger area compared to array-based detectors. This allows a higher sensitivity compared to USB spectrometers.
- The sensitivity of a detector depends massively on the type of detector used. Silicon-based photodiode detectors offer excellent linearity and fast response times in the visible light region with quantum efficiencies between 60-80%. Meanwhile, photomultiplier tubes (PMTs) can achieve higher sensitivities (10-1000 x more sensitive) than photodiodes. This makes PMTs ideal for measuring low signal intensities, such as fluorescence measurements, samples with high absorbance coefficients and low-light detection experiments.
Reducing Stray light, Aberrations and Other Sources of Error
Errors can come from a range of places in spectrophotometry measurements.
Aberrations are errors caused by the optical components design and configuration, often resulting in a blurred or distorted measurement.
The use of lenses can introduce chromatic aberrations, whereas using only reflective elements eliminates this effect. However, the use of concave mirrors can introduce spherical aberrations.

Incorrect alignment of mirrors and other components within a spectrophotometer can also cause astigmatism, where the focal points of the horizontal and vertical components don’t align and the light signal becomes “stretched”. Aberrations have the unusual impact of reducing both spectral resolution and signal-to-noise ratio simultaneously.
Stray light refers to any measured light outside of the desired measurement bounds. In fluorescence spectroscopy, stray light includes scattered excitation light, solvent Raman emission, and any other measurement of light from wavelengths outside the desired emission wavelength. For absorbance measurements, stray light sources can come from ambient light entering the system, or from scattering or fluorescence from the sample. Reducing stray light is incredibly important for accurate spectrophotometry measurements.
Any imperfections in optical components (such as mechanical imperfections or surface roughness in mirrors or gratings) can lead to stray light. Multiple reflections from these imperfections can cause small bright spots within the instrument. These are known as ghost images. Ghost images can also be seen as unexplained peaks in a measurement.
All spectrophotometers exhibit some baseline stray light, but this should aim to be less than 1% of incident intensity with proper instrument design, by maintaining a darkened environment.
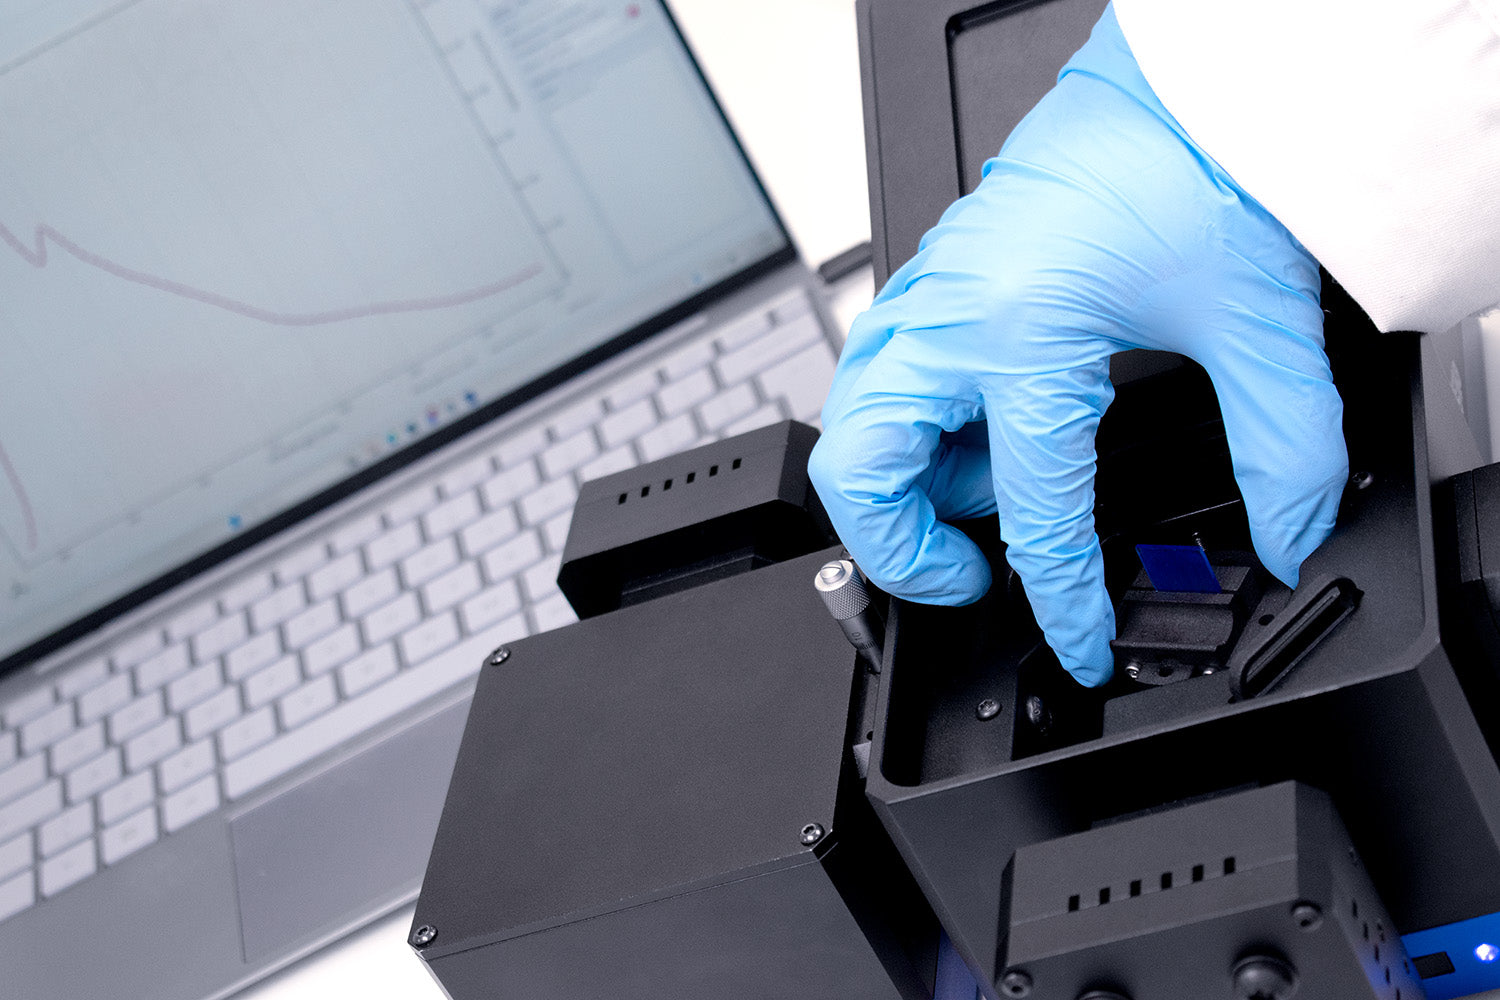
Additionally, ambient light can leak into a spectrophotometry system contributing to the background signal, increasing noise in a measurement. This can significantly interfere with low intensity measurements.
Spectrophotometry Applications
Spectrophotometric Assays
Spectrophotometry is incredibly useful for studying biological samples. It’s non-invasive methodology means you can probe delicate biological materials without damaging them or interrupting key processes you want to measure.
One of the most common applications of spectrophotometry is the spectrophotometric enzyme assay, which tracks how an enzyme catalyzes a reaction. The absorbance spectrum of certain compounds in organic molecules, sometimes known as cofactors, changes when it is bound to an enzyme. Therefore, by monitoring the absorbance spectrum of a sample, you can track enzyme activity in real time.
For example, in the spectrophotometric assay of ascorbic acid oxidase, spectrophotometry quantifies the amount of absorbance at a specific wavelength (usually at 358 nm). This signal signifies the oxidation of ascorbic acid to dehydroascorbic acid and therefore can be used to measure the enzyme's activity. These methods often use microplate reader spectrometers, specialized for spectrophotometric assays.
Molecule Identification
Each molecule has a specific absorbance and fluorescence spectrum. At the very least, molecules often have characteristic peaks or features. Therefore, spectrophotometry can be a simple and easy way to identify molecules in a sample. If reactions are occurring in a solution or if different products form during annealing of a film, this can result in the emergence or disappearance of peaks in absorbance profiles. The location of these peaks can help identify what phases or new compounds are forming.

For example, in the above spectrum of an OPV film, peaks from both o-IDTBR and P3HT can be clearly identified. From the location and intensity of absorbance peaks, the relative concentration of each component can be estimated and some information about their molecular interaction can be inferred. If these peaks are less sharp, this can indicate a better blending of these two materials.
At a low enough concentration, spectrophotometry can investigate the formation of new complexes or signify aggregation in a sample.
Conjugated Organics and Semiconductor Properties
With careful measurement, spectrophotometry can be an accessible and powerful tool to investigate many semiconductor properties.
For organic semiconductors, an increase in the amount of conjugation in an organic molecule will cause a bathochromic shift (where an absorbance peak shifts to a higher wavelength than expected).
For more traditional semiconductors, users can measure the band gap using absorbance spectroscopy, using the Tauc equation.

Where A is an optical constant, h is Planck's constant, α is absorption coefficient, Eg is the material's band gap, and v is the frequency of the photon. γ is a factor that varies depending on the nature of the electronic transition (0.5 for direct band gap semiconductors, 2 for indirect). For indirect bandgap transitions, it is equal to 2.
For direct band gap semiconductors, the band gap can be estimated by plotting (αhν)2 against hv and applying a linear fit to the absorbance edge of this plot. The x-intercept will equal the material’s band gap energy.
For several composite semiconductors, like perovskite solar cells, the band gap changes with different material composition. For example, the incorporation of bromine into a perovskite crystal lattice blue shifts it’s absorbance edge.
Solution Concentration, Optical Density and Impurity Measurements
Beer-Lamberts law provides a simple way to quantify the concentration of an absorbing material in a solution. It is easy to create a reference for a material and a certain spectrophotometry set up, simply by measuring the absorbance intensities of the target material at known concentrations. This method is used in many applications both in laboratories and in the field, from optical density measurements of bacterial cultures to measuring trace impurities in water samples.
Characterizing Device Layers
Most optical or optoelectronic devices require additional layers to function effectively in a device. The desired optical properties of these layers may differ from the optically interesting material. Additionally, extra interlayers can be introduced into a device, specifically to improve its optical properties. Examples of these layers include:
- Antireflective coatings: To increase absorption of light.
- Charge transport layers: To ensure that these layers transmit light of desired wavelength through to the absorbing molecules.
- Up- or down-shifting molecules: To convert wasted light into useful light.
It is important to characterize these independently from the rest of the device.
Spectrophotometry Limitations
While spectrophotometers are valuable in a wide array of applications, there are some measurements that are outside of their ability. Principle amongst these are fluorescence measurements. Fluorescence measurements are often used alongside absorbance measurements to gain a better picture of a molecule's electronic configuration. Absorption is sensitive to ground state of a molecule, but fluorescence is sensitive to its excited state structure. Fluorescence measurements are also more useful for detecting trace impurities in samples.
Furthermore, they struggle to measure absorption of very fluorescent samples. The broadband excitation light may stimulate some fluorescence emission from the sample. This fluorescence is mixed in with the transmitted light, ‘contaminating’ the transmission spectrum.
Both limitations can be overcome by the spectrofluorometer, which includes monochromators, detectors and light sources aligned to measure absorbance and fluorescence measurements with one instrument.
More Resources
 Fluorescence Spectroscopy: Theory, Instrumentation & Uses
Fluorescence spectroscopy measures fluorescence, a process where light is quickly reemitted from a material absorbing incident photons. Unlike phosphorescence, fluorescence occurs almost instantly, making it ideal for analyzing optical properties in materials. The term fluorescence is often used interchangeably with photoluminescence.
Read more... Choosing Spectroscopy Instruments
UV-Vis spectroscopy (or optical spectroscopy) is a simple but effective technique used to probe the molecular structure of a material. Measuring absorbance and emission of light from a sample can give you vital data about:
Read more...