Solar Cell Characterization & Testing
Solar simulators are used for measuring the efficiency of solar cells and modules. To characterize how solar cells will perform in the real world, it is vital that you use a solar source that effectively mimics the spectrum of the sun.
Of coruse, you could use actual sunlight, but this would introduce an uncontrollable variable. To test solar cells reliably, you need to maintain controlled conditions within your lab — and this is impossible to do while allowing direct, unfiltered sunlight onto your testing equipment. Additionally, many potential solar cell materials are unable to withstand weathering effects during the early stages of development. For these reasons, you should use a solar simulator to recreate the suns irradiance when testing solar cells within a laboratory environment.

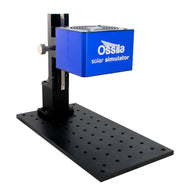
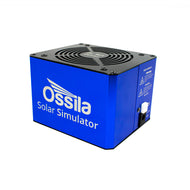
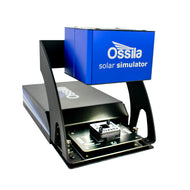
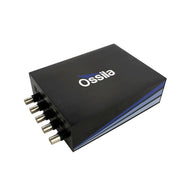
To characterize a solar cell, solar simulators need to meet certain standards regarding temporal stability, spectral match and special uniformity. The Ossila Solar Simulator meets all of these conditions to the highest standard (AAA) for small area devices. You can effortlessly test the efficiency of your solar cell device using the Ossila Solar Cell Testing Kit — which uses the Ossila Solar Simulator in combination with a source measure unit and a test board.
There are several methods used to characterize solar cells. The most common and essential measurement you can take is the current-voltage (I-V) sweep. From this, you can calculate all the necessary device metrics needed to work out the efficiency of your solar cell. The I-V sweep is a quick measurement. Therefore, it is important to note that in some cases, it will not accurately represent how your solar cell would work in a real-world situation. To conduct a more in-depth characterization or to test how stable your device performance is, you could do either maximum power point tracking or current.
Solar Cell Testing Kit

- Unbeatable Value
- Easy Cell Characterization
- Intuitive Software
Worldwide Delivery £3800
Solar Cell Efficiency Measurements
I-V Curve
The I-V curve is the standard measurement in PV research and, when done correctly, can quickly and accurately measure the performance of a photovoltaic device.
There are three metrics which will determine solar cell efficiency: the open circuit voltage (VOC), the short circuit current (JSC), and the fill factor (FF). When measuring solar cells, we often refer to current density, J, rather than just current, I. This allows researchers to compare devices with different active areas. The power conversion efficiency (PCE) of a device is the product of VOC, JSC and FF, divided by the radiant power into the solar cell (Pin).

Pin depends on the light source that you use. It is therefore important that your solar simulator is correctly calibrated to replicate the solar spectrum. This should provide power irradiance at 1 Sun or 1 kW/m2.
You can find the JSC, VOC and FF (and subsequently PCE) of your device from a current voltage measurement. Here, you hold the device at a series of voltages, and measure the current density running through the device at each incremental voltage. This measurement will give you a I-V curve (or more specifically a J-V curve), which will follow the equivalent circuit model of a solar cell.

Here, we can see that the point where the curve crosses the x-axis is equivalent to the JSC, and the point where the line crosses the y axis defines VOC. Fill factor is a little more difficult to define - it is a measure of the "squareness" curve. There is a point on the curve where the J and V values are maximised to form the maximum power point (MP). These are called JMP and VMP respectively, and they create a shaded rectangular area of theoretical maximum power available through JMP x VMP. The fill factor can be defined using the following equation:

You can find JMP and VMP by working out the point at which J x V is largest. You can use these numbers with the JSC and the VOC to calculate the FF. This should be done computationally to ensure consistent measurement. However, the Ossila software will output all the device metrics whenever you measure a J-V curve.
For solar cells with complex ion behaviours, such as perovskites, using the appropriate scan speed for device testing is important.
For the most accurate classification of solar cells, it is of the utmost importance that the spectral irradiance is calibrated to the best of your ability.
Power Point Tracking
For solar cells that show hysteresis or for unstable solar cells, you may find it useful to measure stability of your solar cells, using measurements like power point tracking or stabilised current measurements. This should give you a better idea of how your solar cell would perform in real world conditions.
There are several definitions of power point tracking, but for all stabilised measurements, you need to do an initial J-V sweep to find the maximum power point (= VMP x JMP). Once a value for VMP has been determined, you can hold the solar device at this voltage and measure the current produced over the course of the measurement. You can stop the measurement either after a set time has elapsed, or once a predetermined "stabilised condition" has been met (e.g. once the current output has remained stable for 30 seconds). The latter of these conditions is also known as the stabilized current at fixed voltage (SCFV). By multiplying the measured current by VMP, you can track the PCE of a device in real time.

Maximum power point tracking is a more sophisticated version of power point tracking, where the VMPP is continually measured and optimised while the stabilised measurement occurs. A complex programming system continually assesses the MPP of the device, and subsequently holds the solar cell at this voltage. This form of maximum power point tracking is often used to control power output in arrays of solar modules.
Dynamic I-V Measurement
In dynamic I-V measurements, you measure the current response at a variety of voltages, just like for a J-V sweep. However, in this measurement, you wait for the measurement to stabilize for a set amount of time before noting the current density.
This gives a very accurate representation of solar cell performance. In fact, a study comparing the measurement of solar cells by different laboratories believed this was the most reliable method of characterizing perovskite solar cells. However, a full J-V sweep can take a long time to measure, especially if the solar cell exhibits dynamic behaviour. For instance, it took several hours to measure one J-V curve for a perovskite solar cell using dynamic I-V measurement.
This measurement is only necessary to measure the J-V characteristics of a solar cell with absolute certainty, and only if the solar cell you are testing exhibits dynamic properties under illumination such as perovskite solar cells.
Ideality Factor and Light Intensity Studies
Studying the performance of solar cells under varying light intensities can help you identify different recombination mechanisms in these solar cells. You can find this by determining the ideality factor of your solar cell. From solar cell theory, we know that current varies with applied voltage across a device related to the following equation:

In this equation, J is current, V is voltage, T is temperature and n (or nid) is the ideality factor. For an "ideal" diode you can assume that n=1. However, you can obtain valuable information about the types of recombination that are occurring in your device by finding the ideality factor, nid.
The ideality factor of a solar cell will vary depending on the dominant recombination mechanism in your semiconductor. Recombination can occur within the semiconductors band gap, or it can happen at the interfaces between the absorber materials and the charge transport layers. Additionally, you can classify recombination as monomolecular or bimolecular.
Bimolecular recombination (rbi) is the same as radiative recombination. It involves the combining of an electron in the conduction band with a hole in the valence band, thus producing a photon. However, you can also have non-radiative recombination to trap states within the absorber, otherwise called Shockley-Read-Hall recombination. This occurs within the band gap (rSRH) and is also known as monomolecular recombination due to the electrons and holes moving separately. The amount of rbi compared to rSRH depends not on the defect density of the material but on the optical properties of the semiconductor. Ideality factor will be near 1 if bimolecular recombination dominates, and near 2 if monomolecular recombination is dominant.

You can measure the ideality factor from the dark J-V curve. However, this measurement will not account for the fact that some shallow defect trap states are filled quickly when the semi-conductor is illuminated. Here, the solar cells work perfectly well.
Another trusted way of measuring the ideality factor of a solar cell is by doing a light intensity study. To do this, you measure a J-V curve from the solar cell at various fractions and/or multiples of 1 Sun, and the linear relationship between VOC and light intensity will give you the ideality factor. The other device metrics can also provide insight into which recombination mechanisms are dominating within your device. Interestingly, recent studies have found that different metrics have different dependencies on light intensity. For example, while organic and perovskite solar cells show a quasi-linear dependence of JSC on light intensity, VOC and FF dependencies are different at high and low light intensities.
Various models have been used to simulate this light intensity dependence. By comparing experimental results with these theoretical models, light intensity studies suggest many things about your device, including:
- If there is significant shunt or series resistance in your device.
- The trap density of your SC material.
- Whether bulk or interface recombination is dominant.
To take these measurements, your light intensity source will need to be calibrated to multiple values of suns. You will need to do this using a reference solar cell. For LED light source solar simulators, you can change the incident light intensity on your device by varying power supply to the light source. Alternatively, you can reduce the power irradiance further by moving the light source radially away from the device. It is especially important that you externally check the solar irradiance any time your device testing equipment is moved.
Solar Cell Testing Kit
- Unbeatable Value
- Rapid Cell Characterization
- Easy-to-Use
Worldwide Delivery £3800
References
- Bardizza, G., Müllejans, H., Pavanello, D., & Dunlop, E. D. (2021). Metastability in performance measurements of perovskite PV devices: A systematic approach *. Journal of Physics: Energy, 3(2), 021001. https://doi.org/10.1088/2515-7655/abd67
- Glowienka, D., & Galagan, Y. (2021). Light intensity analysis of photovoltaic parameters for perovskite solar cells. Advanced Materials, 34(2), 2105920. DOI: 10.1002/adma.202105920
- Hua, C. C., Fang, Y. H., & Wong, C. J. (2018). Improved solar system with maximum power point tracking. IET Renewable Power Generation, 12(7), 806–814. https://doi.org/10.1049/iet-rpg.2017.061
- Ryu, S., Ha, N. Y., Ahn, Y. H., Park, J.-Y., & Lee, S. (2021). Light intensity dependence of organic solar cell operation and dominance switching between Shockley–Read–Hall and bimolecular recombination losses. Scientific Reports, 11(1). DOI: 10.1038/s41598-021-96222-
- Sarritzu, V., Sestu, N., Marongiu, D., Chang, X., Masi, S., Rizzo, A., Colella, S., Quochi, F., Saba, M., Mura, A., & Bongiovanni, G. (2017). Optical determination of shockley-read-hall and interface recombination currents in hybrid perovskites. Scientific Reports, 7(1). DOI: 10.1038/srep44629