Absorbance & Absorption Spectroscopy

Absorbance occurs when an electron in a material is excited from its ground state to an excited electron state by absorbing a photon. Measuring absorbance can be very helpful for probing the internal electronic structure of a molecule, as well as defining its optical properties.
In absorption spectroscopy (also known as absorbance spectroscopy), a spectrometer, such as the Ossila USB spectrometer, or a spectrofluorometer measures the amount of light absorbed by a sample as a function of wavelength.
In absorption spectroscopy:
- A broadband light source is directed through a sample.
- A spectrometer or spectrophotometer measures the intensity and wavelengths of light that is transmitted through the sample.
- This transmission spectrum is compared to a reference spectrum (i.e. the original spectrum with no sample in place).
- You can then calculate absorbance using the logarithmic of the ratio of initial light intensity (I0) vs. transmitted light (I).

Absorbance values are unitless and always wavelength dependent. However, for solution and solid samples other values can referenced in specific circumstances, such as the molar attenuation coefficient and extinction coefficient respectively.
Absorption spectroscopy can provide important information about the molecular structure, concentration or optoelectronic properties of a sample. It can also provide key insights into dynamic material properties, such as phase changes or composition changes.
Absorbance Theory
In absorbance spectroscopy, light is used to probe the structure of a material. An absorbance spectrum will tell you how much light will be absorbed by a sample at varying wavelengths giving you insight into its electronic properties.

Electronic Levels
Absorbance occurs when the energy of an incoming photon (Ephoton) is equal or larger than the energy difference (ΔE) between the highest occupied molecular orbit (HOMO) and the lowest unoccupied molecular orbit (LUMO). If this condition is met, an electron in the HOMO can be excited into the LUMO.

You can describe these transition energies in terms of photon wavelength (λ). Wavelengths of the absorbed light correspond to energy through the following equation.

In some materials, such as semiconductors, all light above ΔE will be absorbed. In the image, we can see that if the photon is Eph > ΔE, an electron will absorb the photon, exciting it from HOMO to LUMO. However, if the photon is below this energy, it will not be absorbed.
Other materials will only absorb light at specific energies. The position and intensity of these absorption bands depend on the structure, bonding, and electronic configuration of the sample.
The types of electronic transitions allowed within a sample, which can be seen in the absorbance spectrum, vary drastically with different material properties. Measuring the wavelengths at which absorbance occurs can tell you a lot about the electronic states within your material, molecule or thin film.
Beer-Lambert's Law
Absorbance is measured by comparing the reference light spectrum, I0, to the light that is transmitted through the sample, I, at each wavelength.
As well as wavelength of incident light, absorbance depends on sample concentration (c) and path length (L) according to Beer Lambert’s Law:

The logic behind this is quite simple. As light moves through a sample, it is more likely to be absorbed. Additionally, the more absorbent material there is in your sample, the more likely it is that light is absorbed. Therefore, the intensity of transmitted light will fall exponentially with both distance traveled and concentration. There are several versions of this equation (see defining absorbance) but they all factor in concentration, path length and one other variable which quantifies the materials ability to absorb light at this wavelength. In the above equation, this is represented by the molar attenuation co-efficient, ε.
Measuring Absorbance
Measuring absorbance requires a broadband light source and an optical spectrometer with appropriate spectral range. You can also use a spectrophotometer for this measurement, which are specially designed to measure absorbance with high accuracy and reliability. Absorbance measurements are closely related to transmission , as in both cases you actually measure the transmitted light.

As light moves through a sample, it is more likely to be absorbed. Therefore, the intensity of transmitted light will fall exponentially with distance.
Defining Absorbance
Absorbance is a relative measurement so is therefore unitless. Having said this, absorption properties of different samples can be defined in a number of different ways.
Molar Attenuation Coefficient
When you measure the absorbance spectrum of a solution, one important factor is the wavelengths where maximum absorbance occurs. Identifying these wavelengths can can help you determine certain molecular properties of your sample. You can also note the strength of absorbance at these wavelengths.
By looking at these peaks, you can establish the molar attenuation coefficient, ε. This has also been referred to historically as the molar extinction coefficient and is also known as the molar absorptivity coefficient. This will tell you about the kinds of electronic transitions that are occurring within your sample associated. For allowed transitions, ε > 1000 whereas for forbidden transitions, ε < 100.
The molar attenuation coefficient, ε, is featured in Beer Lambert's Law:

Where A is absorbance, c is the molar concentration of the molecule in solution, and l is the path length through the sample (often the width of the cuvette, or the total film). You can use this calculation to measure the concentration of a molecule in a thin film. The graphs below show the variation in absorbance intensity with concentration.


Molar attenuation coefficient has property has dimensions of

Therefore, the SI units of the molar absorptivity coefficient is m2M-1 or cm2M-1.
Absorption Coefficient
For bulk solids, you can define absorbance in terms of an absorption coefficient, α(λ). This is a property of a solid material and is wavelength dependent. The absorption coefficient, α(λ) relates to absorbance measurements through the following equation:

Here, d is the distance light has traveled into (or through) the bulk solid.
The SI units of the absorption coefficient of a bulk solid are m-1 or cm-1.
Absorbance Units
| Property | Units | Sample Type |
|---|---|---|
| Absorbance | Unitless | General |
| Absorption Coefficient | m-1 | Bulk Solid |
| Molar Absorptivity Coefficient | m2M-1 | Molecule in solution |
Absorbance Uses
You can use absorbance spectroscopy to investigate the suitability of a material for specific purposes. For example:
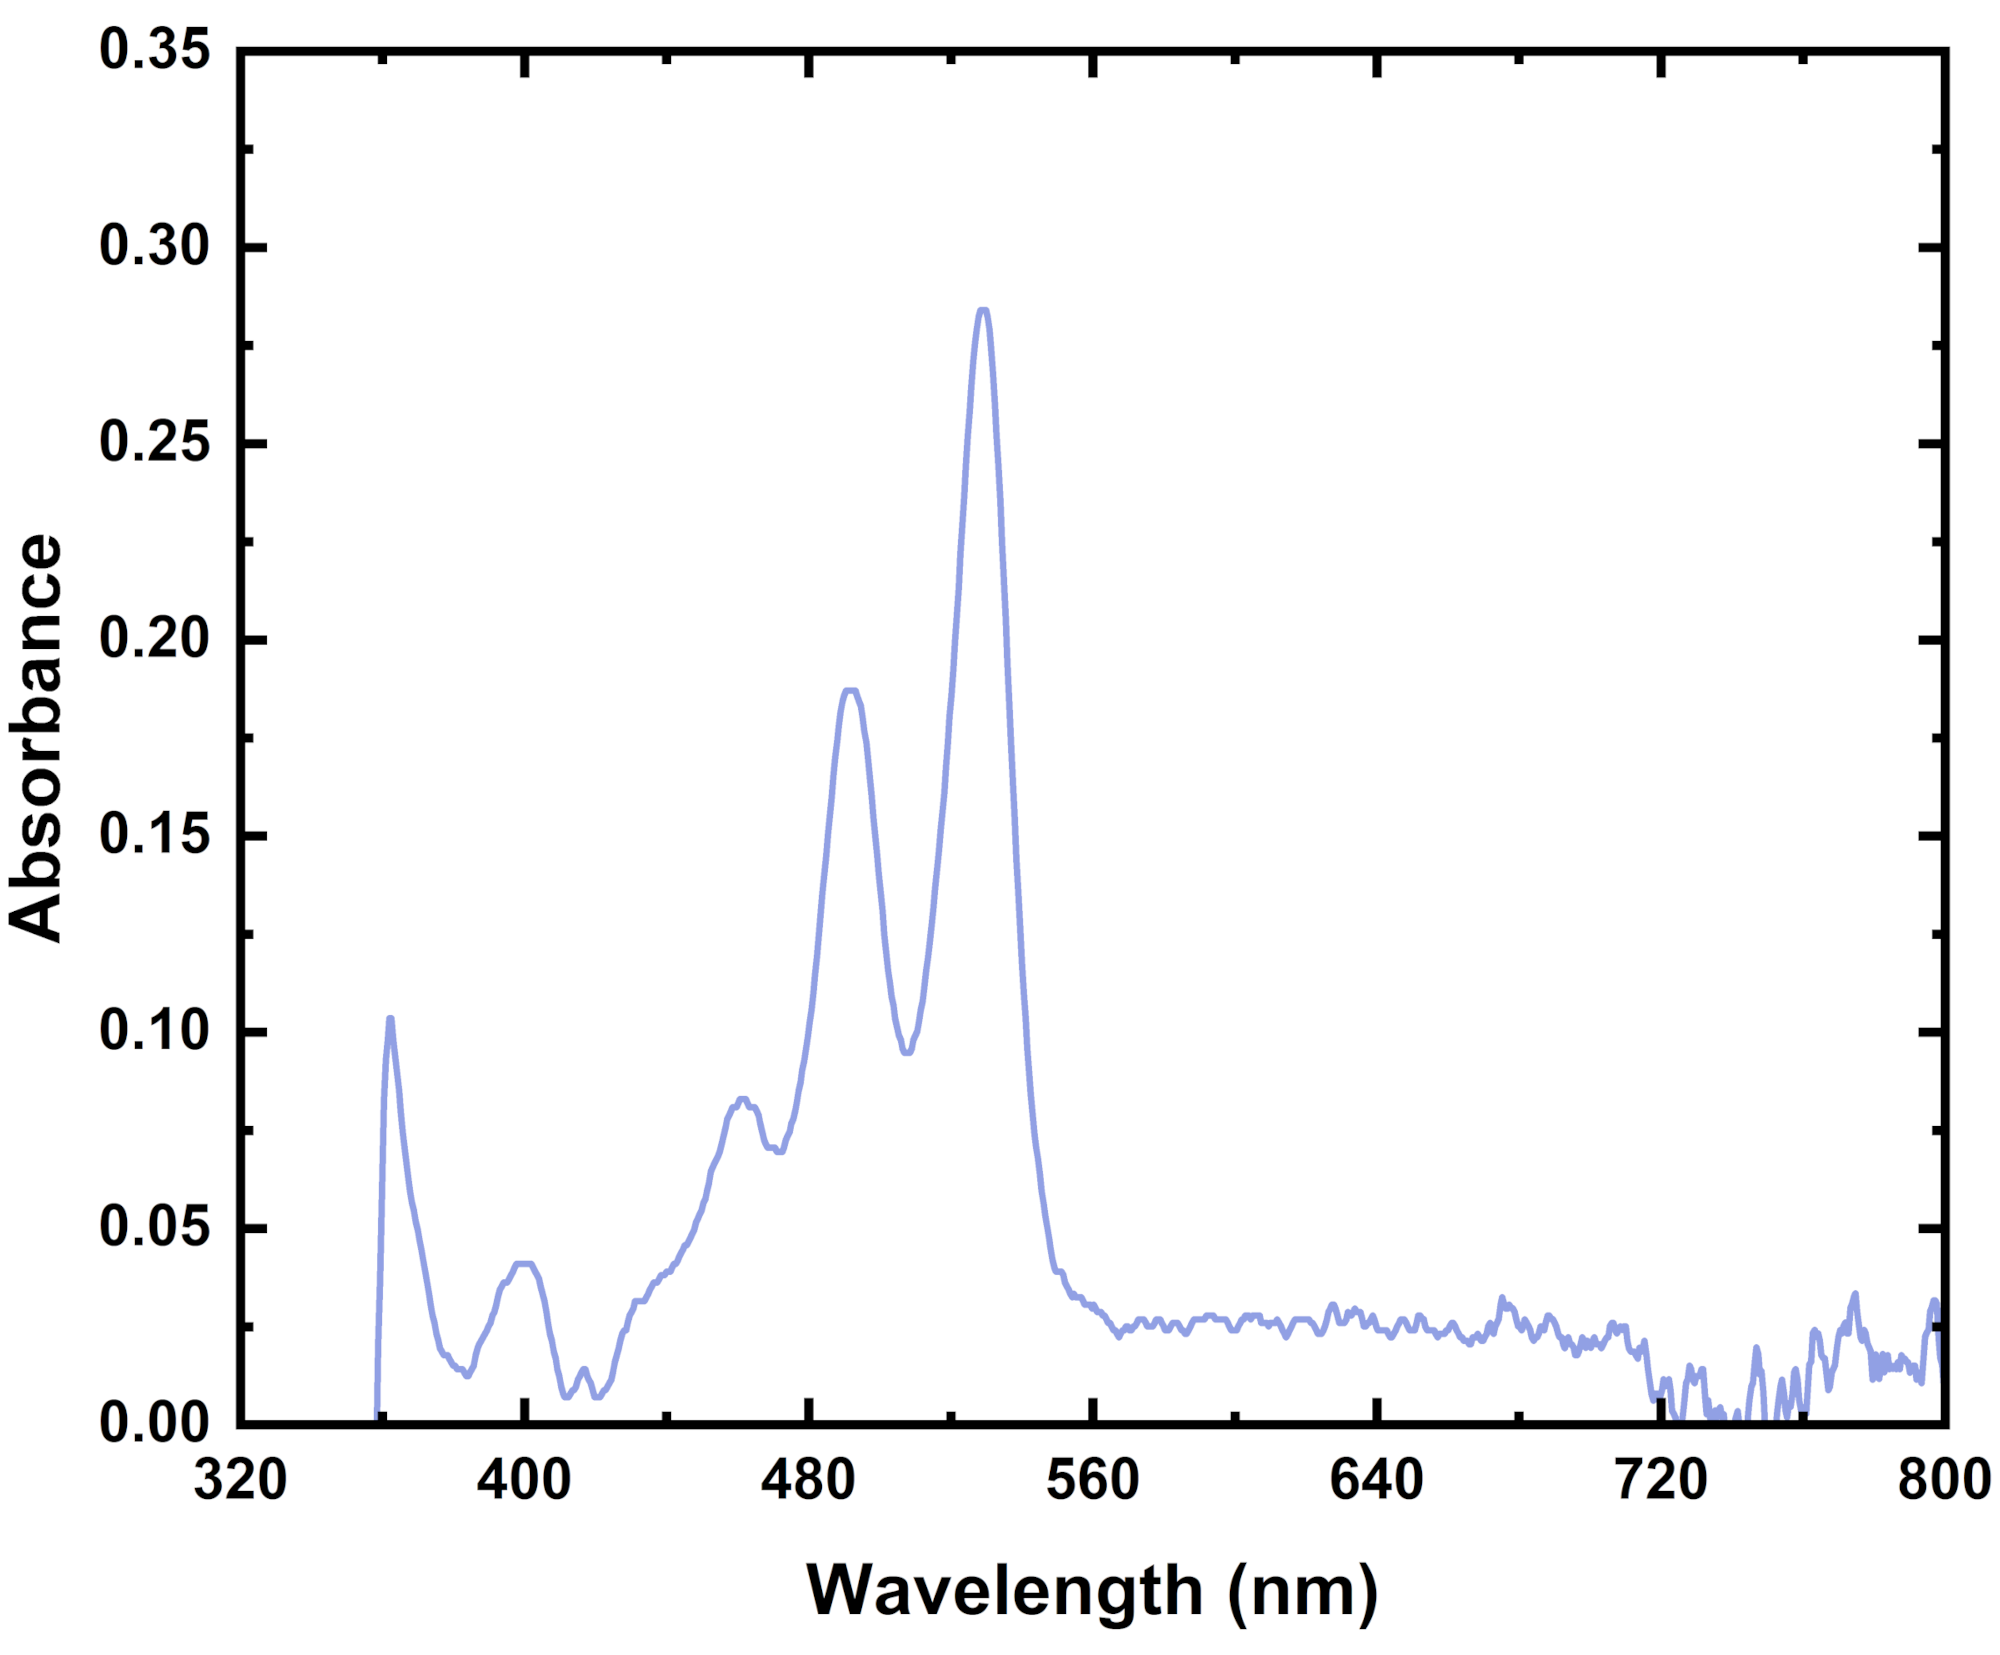
- Organic dyes require high absorbance over a small wavelength range so that only light of a matching color is emitted from the dye, e.g. for a yellow dye, blue light (435 - 480 nm) must be absorbed.
- Materials that convert visible light into different forms of energy (such as solar cells, photosensors) will require high absorption, ideally across the visible region. These materials frequently have desirable band gaps, which can be determined using absorbance spectroscopy.
- Transparent materials need to absorb as little visible light as possible. You can confirm this using UV-Vis spectroscopy.
- In organic compounds, UV-vis spectroscopy can help illuminate the amount of conjugated pi bonds in a molecule.
USB Spectrometer

Resources and References
 Absorbance Measurement
Absorbance measurements are crucial in many areas of scientific research. This article describes how to take an absorbance measurement using an optical spectrometer.
Read more... Choosing a Spectrometer
When researching optical materials, an optical spectrometer is an essential instrument which enables you to characterize your materials quickly and easily. It is a powerful tool that can be used to measure the properties of light such as wavelength and intensity
Read more...References
- Rocha, F. S., Gomes, A. J., Lunardi, C. N., Kaliaguine, S., & Patience, G. S. (2018). Experimental methods in chemical engineering: Ultraviolet visible spectroscopy-UV-vis. The Canadian Journal of Chemical Engineering, 96(12), 2512–2517. DOI:10.1002/cjce.23344
- Hestand, N. J., & Spano, F. C. (2018). Expanded theory of H- and J-molecular aggregates: The effects of vibronic coupling and intermolecular charge transfer. Chemical Reviews, 118(15), 7069–7163. DOI: 10.1021/acs.chemrev.7b00581
- Makuła, P., Pacia, M., & Macyk, W. (2018). How to correctly determine the band gap energy of modified semiconductor photocatalysts based on UV–vis spectra. The Journal of Physical Chemistry Letters, 9(23), 6814–6817. DOI: 10.1021/acs.jpclett.8b02892
- Chen, J., Zhou, S., Jin, S., Li, H., & Zhai, T. (2016). Crystal organometal halide perovskites with promising optoelectronic applications. Journal of Materials Chemistry C, 4(1), 11–27. DOI: 10.1039/c5tc03417e