Contact Angle Measurements on Uneven Surfaces
Preparing for Analysis | Setting a Region of Interest | Baseline Positioning | Improving the Polynomial Fit
A sloped surface is usually just any flat surface at an angle. This has a linear gradient and can be flattened by adjusting the tilt of the sample stage, or rotating the video or image in the software included with the Ossila Contact Angle Goniometer.
Conversely, an uneven surface is a surface with a non-linear gradient which cannot be flattened by adjusting its angle. A non-linear gradient means that a single linear baseline cannot be used for the entire width of a droplet. This is shown by the red line in the figure above.

This guide will help you overcome the difficulties of using an uneven surface in your contact angle measurements. We assume that you have already recorded a video of a droplet, and are currently in the process of analyzing it.
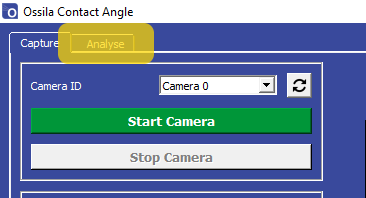
Preparing for Analysis
Open the software and click the ‘Analyze’ tab in the top left of the window.
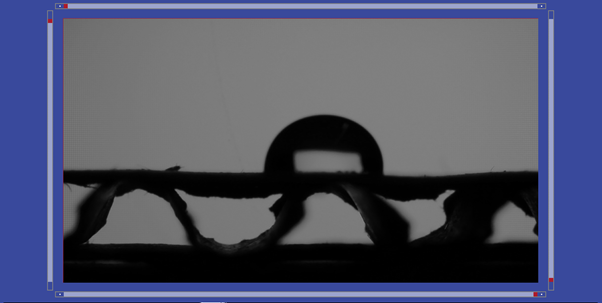
Load the video to be analyzed using the ‘Load Video’ button. The video will appear in the central display. Navigate through the video frames until you find a frame that you would like to analyze. The figure below shows a droplet on a piece of cardboard that has variations in surface flatness.
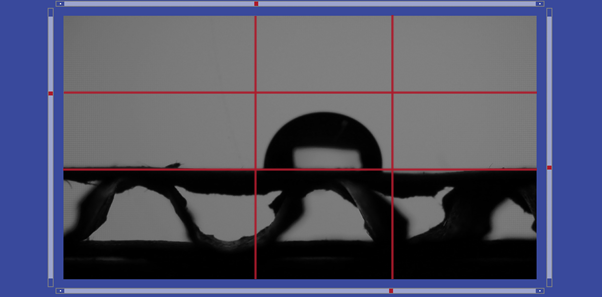
Setting a Region of Interest
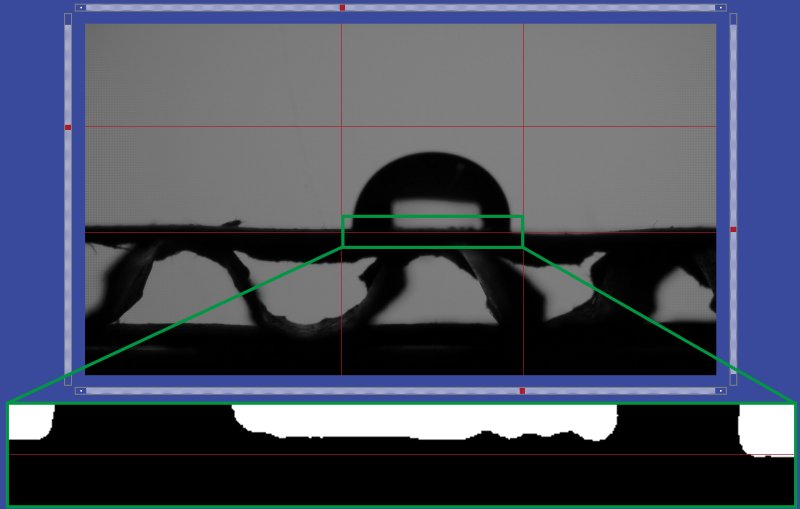
Move the region of interest (ROI) sliders until they surround the droplet as shown in the figure below. The bottom horizontal line represents the baseline of measurement, which is the basis of the contact angle measurement. The left, right and top lines determine the part of the image that will be used in the measurement.
Baseline Positioning
The contact angle measurement is performed at the point where the droplet edge meets the baseline. A magnified version of this region is displayed beneath the main viewer, as shown by the green boxes in the figure below. A black and white threshold is applied to the magnified image, which allows us to see the droplet edge more clearly.
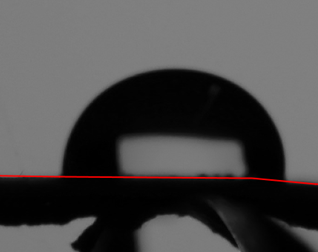
The baseline in the figure above intersects the right edge of the droplet at the point where it meets the substrate. On the left edge however, the baseline position is below the top of the substrate.
If the substrate was completely flat, then this difference could be due to the tilt of the stage, or the angle of the camera relative to the substrate. In that case, we would rotate the video so that the two contact points were level before performing the measurement.
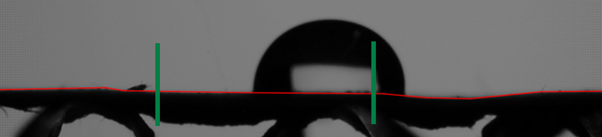
In the figure above the flatness of the substrate varies beneath the droplet, so it is not possible to simply level the video or baseline. This variation is highlighted in the figure below. Most of the droplet volume is on a flat area, but the right edge of the droplet is on an area that is sloped downwards relative to the left edge.
One solution to this is to set the baselines for the two edges independently. We can perform the measurement on the left edge, then change the baseline position and perform the measurement on the right edge, as seen below.


Another solution is to deposit a droplet on a flat area of the substrate. There is an area to the left of the droplet that would have been more optimal for deposition due to its flatness as seen below. If it is difficult to find a large and flat area, then reducing the volume of the droplet will reduce its diameter and make it easier to find a flat region of substrate in which it will fit.
Improving the Polynomial Fit
The contact angle measurement involves fitting a polynomial to the edge of the droplet. The two most important ROI lines for this fitting are the bottom line (the baseline) and the top line. The bottom line defines where the contact angle measurement will be performed. The top line defined the part of the droplet edge that will be used for fitting the polynomial. The figure below shows what happens when we don’t choose our ROI carefully. The polynomial fit (red) is poor and the calculated angle is quite wrong.
With larger contact angles (angles above ~ 60°), you can get a much better fit if the top line is lowered to half way up the droplet, as shown by the red line in the figure below. The polynomial fits much better to the edge data.
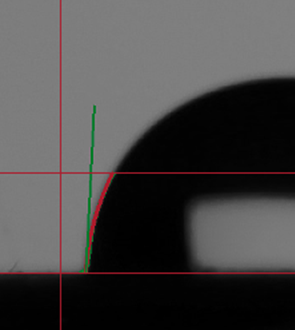
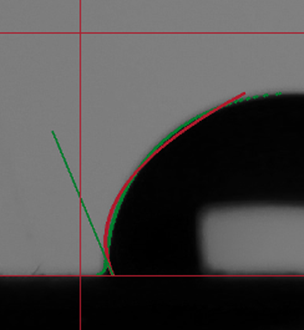
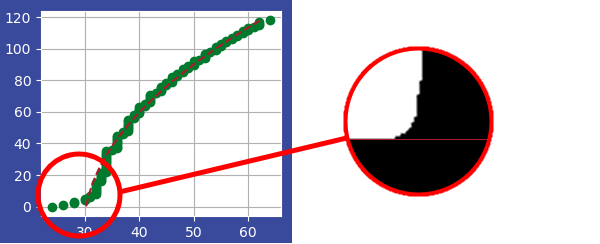
This is a much better fit, but we can still improve the accuracy of the measurement by looking at the polynomial plot in the bottom left of the Analyze tab, as seen in the figure below. The plot shows the edge of the droplet in green and the polynomial fit in red. The right side of the figure shows the intersection of the baseline with the droplet. We can see that there is a small meniscus formed between the droplet and the surface. This can happen if the droplet moves from its original position, or begins to evaporate and shrink after deposition. The meniscus reduces the accuracy of the polynomial fit, as the shape of the droplet edge with a meniscus is not well suited to a polynomial.
If we raise the baseline slightly, as shown below, we can see that the polynomial fit matches the edge much better.
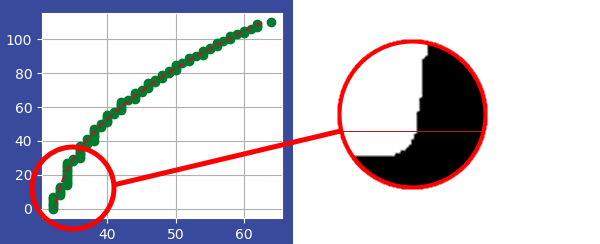
Using the ROI positioning method from the figure above and the separate-side technique shown earlier in this tutorial, we can analyze the left and right contact angles of the droplet. These are shown in the plot below. The higher contact angle of the right side of the droplet is due to the slight slope.

Contact Angle Goniometer
Learn More
 Contact Angle Measurements of Surface Wetting
Surface wetting occurs when a droplet spreads out over a surface, such that its contact angle is below 90°. When the droplet spreads out completely, this angle will be 0°, and 'complete wetting' will have occurred.
Read more... Contact Angle: Theory and Measurement
This guide will explain what a contact angle is and how it is measured. It will also show you how the Ossila Contact Angle Goniometer works and how to get the best measurement results.
Read more...