
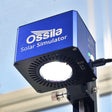
Class AAA System For Small-Area Solar Cells
Quick, easy, and reliable photovoltaic testing
Overview | Specifications | Features | Gallery | Software | In the Box | Resources and Support
A carefully calibrated array of LEDs bring you a high quality spectrum at impressively low costs. Achieve excellent spectral match and high spatial and temporal uniformity for testing small area devices. Following IEC 60904-9:2020 international standards, the Ossila LED Solar Simulator easily achieves:
- AAA Classification over 15 mm diameter area
- ABA Classification over 25 mm diameter area
Start reliably testing your solar devices immediately with easy setup, minimal maintenance, and no warm up time. For a complete testing solution, the LED lamp is included in the solar cell testing kit.
Tuneable Spectrum
Individual LED control
Extended Lifetime
10,000+ operating hours
Short Warm-up Time
Switch on and use in seconds
No Explosion Risk
Safe and efficient LED bulb
Specifications
| Spectral Match | A |
|---|---|
| Spatial Uniformity (over 15 mm diameter area) | A |
| Spatial Uniformity (over 25 mm diameter area) | B |
| Spatial Uniformity (over 32 mm diameter area) | C |
| Temporal Instability | A |

| Type | LED-based, steady state |
|---|---|
| Spectral Deviation | <70% |
| Spectral Coverage | >80% |
| Working Distance | 8.5 cm (3.35") |
| Irradiance (at working distance) | 1000 W/m2 |
| Wavelength Range | 350 nm - 1000 nm |
| Maximum Lamp Time | 10000 hours |
| Lamp Dimensions (L x W x H) | 10.5 cm x 9.0 cm x 8.0 cm (4.13" x 3.54" x 3.15") |
| Weight | 600 g (1.32 lbs) |

Classification
The Ossila LED Solar Simulator is AAA rated for small area devices, which is ideal if you already use our 20 mm x 15 mm substrates. It also delivers class ABA illumination for testing large area devices which can be made on our 25 mm x 25 mm substrate systems. We individually calibrate each system with a NIST traceable photo radiometer and include a performance report with each unit.
Spectral Irradiance

The programmed spectral irradiance of the LED solar simulator is at 1 Sun (left). Automatically, the lamp emits a total integrated power of 100 mW/cm2 (1 Sun) over the wavelength range 350 nm – 1000 nm. Our LED solar simulator achieves a Class A rating within each wavelength range for small area devices.
The Ossila LED Solar Simulator also allows you to adapt the output spectrum of your lamp as you desire. The graph on the right shows a spectral distribution at 0.7 Suns. This matches the AM 1.5G spectral shape, accounting for the portion above 1000 nm.
Spectral Match

Spatial Uniformity

Temporal Instability

The spectral match classification measures how well an LED solar simulator replicates the solar spectrum according to wavelength distribution. The Ossila LED Solar Simulator achieves Class A output in all wavelength categories at 1 Sun irradiance.
At a working distance of 8.5 cm and output power of 1 sun, our solar simulator achieves a spatial non-uniformity Class A rating over a 15 mm diameter. It also achieves a class B rating over 25 mm diameter, and a class C rating at 32 mm diameter.
The temporal instability classification measures the output consistency. Our solar simulator easily achieves Class A temporal instability. Conduct long-term experiments or lifetime measurements without worrying about spectral fluctuation.
Documentation
![]() Example calibration certificate
Example calibration certificate
LED Solar Simulator Features
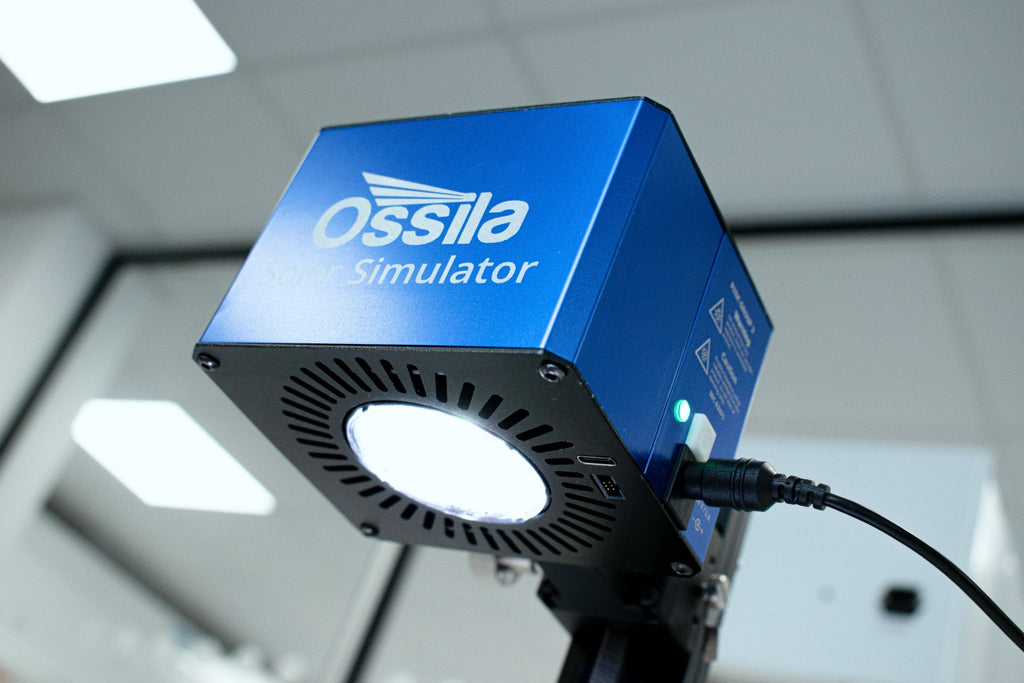
Reliable LED Light Source
The LED solar simulator has a calibrated array of light-emitting diodes to reliably and accurately mimic the solar spectrum. This light source has a long lifetime, good temporal stability, low running costs, zero maintenance, spectral tunability, less hazardous bulbs, and no explosion risk.
Modular and Compatible
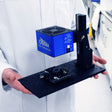
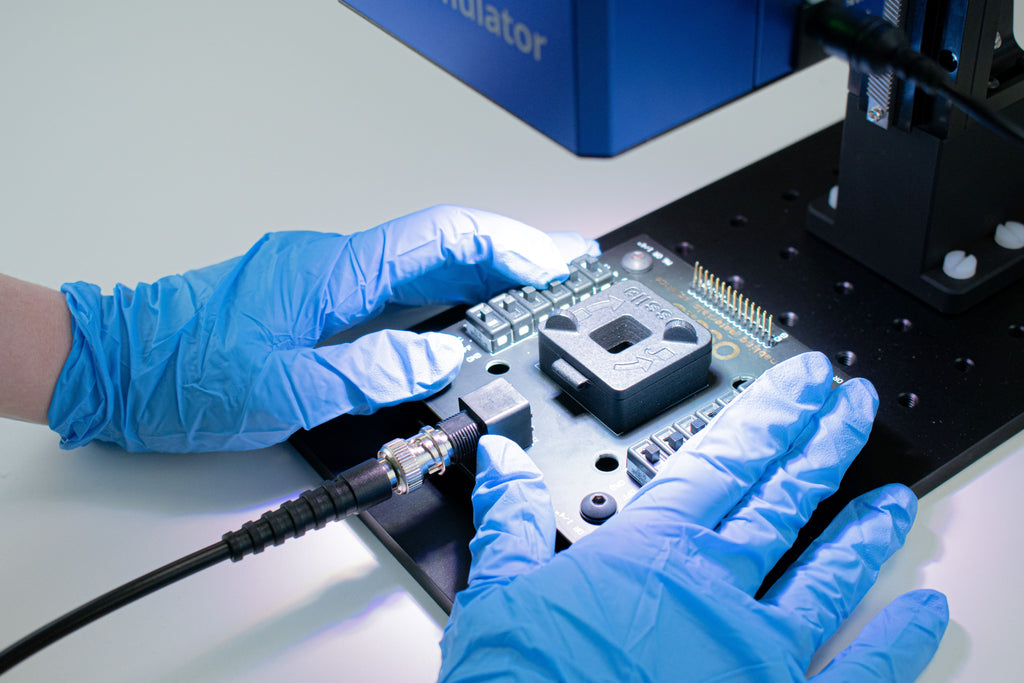
The Ossila LED Solar Simulator is compatible with our solar cell testing systems, testing boards and substrates so you can set up a high quality solar cell testing lab. However, its modular design also allows you to design your own testing system. The manual LED solar simulator is easily mounted onto standard breadboards, and can be easily controlled via serial commands.
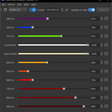
Easy-to-Use Software, Adaptable Spectrum
Our LED lamp will automatically deliver a calibrated output optimized to meet the solar spectrum. However with our free, downloadable software, you can control each LED output individually as well as change the total irradiance output. As of 2024, our system can also be calibrated to test indoor photovoltaics according to newly defined standards.
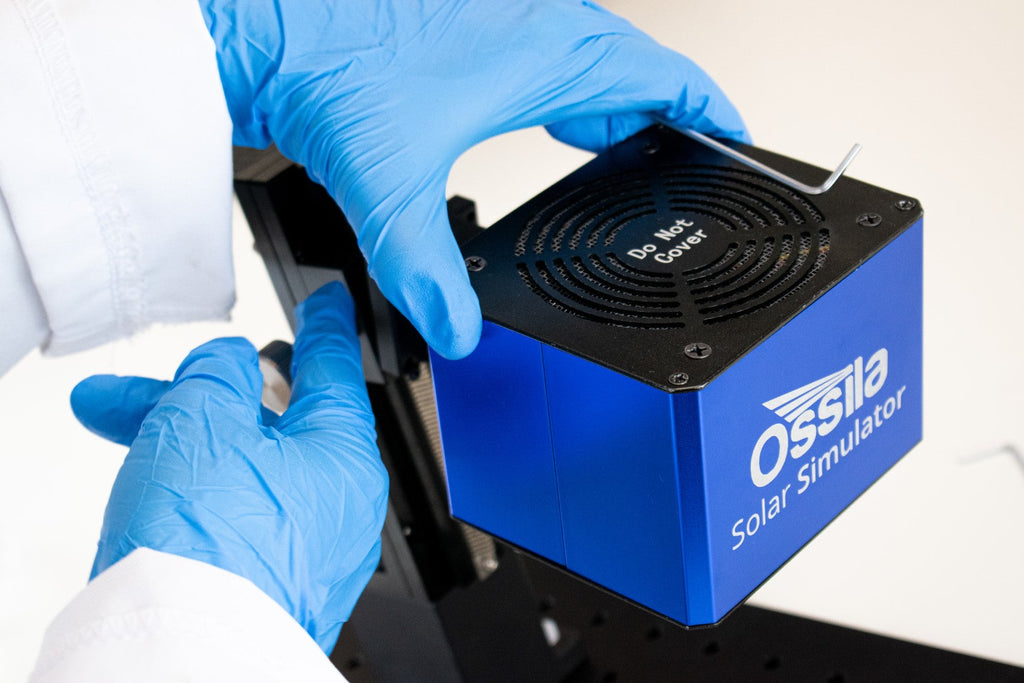
Compact Design, Adaptable Functionality
The small footprint is perfect for high-density laboratories and it can also be used in closer spaces where space is limited, such as a glove box*, or in a laminar flow hood. With its own optical breadboard included, it can be placed on any work top, or even fixed to larger optical benches.
* Not for use in volatile environments.
LED Solar Simulator Gallery

Software
The Ossila Solar Simulator Console enables you to control and customize the output of your LED solar simulator. You can choose the overall power level or control each LED individually to tailor the output to your specific requirements. The user-friendly software can be installed on as many PCs as you want and you can access future updates for free.

Software Requirements
| Operating System | Windows 11 (64-bit) |
|---|---|
| CPU | Dual Core 2 GHz |
| RAM | 4 GB |
| Available Hard Drive Space | 152 MB |
| Monitor Resolution | 1440 x 960 |
| Connectivity | USB |
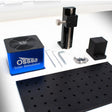
In the Box
- LED solar simulator
- Optical breadboard
- Adjustable height stand
- USB Driver with calibration certificate & QC test data
Resources and Support
 What is Different About the Ossila LED Solar Simulator?
A solar simulator is an essential piece of equipment for any lab working with photovoltaics, optoelectronics, or any research that requires a simulated sunlight environment. They provide an accurate and repeatable source of light that is essential for conducting photovoltaic research. But how do you choose the right solar simulator?
Read more... Controlling The Solar Simulator With Solar Simulator Console
The Ossila Solar Simulator Console enables you to control and customize the output of your LED solar simulator. You can choose the overall power level or control each LED individually to tailor the output to your specific requirements. The user-friendly software can be installed on as many PCs as you want and you can access future updates for free.
Read more...