Photoluminescence Spectroscopy

How to Measure Photoluminescence | Photoluminescence Quantum Efficiency | Steady-State vs. Time Resolved Photoluminescence | Interpreting Photoluminescence Spectra | Example of Fluorescence Spectroscopy
Photoluminescence spectroscopy is an analytical technique used to study the electronic and optical properties of materials. When photons excite electrons to higher energy states, the subsequent relaxation back to lower energy states results in the emission of light, which is analyzed to provide information about the material's band structure, defect states, and composition. This non-destructive method is widely used in material science, chemistry, and semiconductor research to investigate and characterize various material properties.
There are several ways to categorize photoluminescence. You must first consider that both radiative and non-radiative emissions will occur within your sample. As a form of radiative emission, photoluminescence can then be separated into two main classifications - fluorescence and phosphorescence. These both have different energy transition pathways, and therefore very different lifetimes. One main way of quantifying photoluminescence efficiency is by measuring the photoluminescent quantum efficiency (PLQE) of a sample. You could also measure its photoluminescent quantum yield (PLQY).
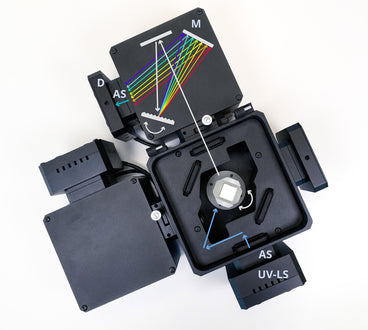
You can perform accurate photoluminescence spectroscopy using a spectrofluorometer, which relies on multiple monochromators to isolate specific wavelengths and provide complete control over excitation and emission. You can also measure photoluminescence using CCD array spectrometers such as the Ossila USB Spectrometer. This will require a separate high energy excitation source. In either set-up, the excitation source will work to excite electrons into their higher energy states. As they relax, the electrons will then emit photons of a lower energy, which can be detected by your optical spectrometer.
Browse Spectroscopy Equipment

How to Measure Photoluminescence
During photoluminescence, high energy photons are absorbed by the sample, exciting electrons into higher energy states. For most fluorescent samples, light will be re-emitted almost immediately in the form of lower energy photons. However, some emitters have a delay between light absorbance and emission. These samples are phosphorescent.
In the most basic terms, measuring photoluminescence requires a high-energy excitation source combined with a detector that can measure emitted light. Many photoluminescence set-ups use a monochromatic light source such as a continuous wave laser, or UV light source. Alternatively, you can use a broadband white light source in combination with a filter, or a tunable light source to select a suitable excitation wavelength. The detector will need to measure both the intensity and wavelength of emitted light. Some systems use single pixel detectors, such as silicon photomultipliers, combined with a monochromator to measure this intensity wavelength-by-wavelength. Alternatively, you can use an array-based spectrometer, which measures the intensity of all wavelengths simultaneously.
When measuring photoluminescence, we also recommend that you measure the absorbance spectra of your sample. These measurements are complementary. Absorbance can probe the ground state of your material, while PL can better probe excited states. Absorbance measurements can also reveal the best excitation wavelengths to use for fluorescence measurements.
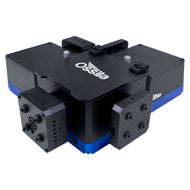
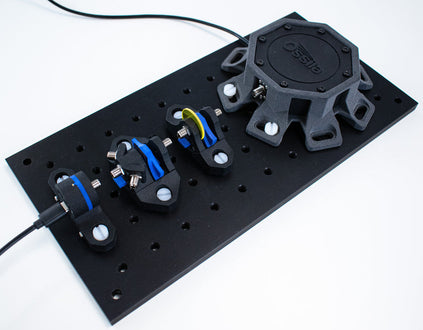
Measuring PL with the Ossila Spectrofluorometer
Spectrofluorometers are set-up and calibrated to perform photoluminescence measurements consistently and easily, as well as absorbance and transmission measurements.
To measure photoluminescence emission with the Ossila Spectrofluorometer:
- Place your sample into the dedicated sample holder and secure the lid.
- Navigate to the Emission measurement tab in the Spectrophotometry software.
- Define wavelength step, start wavelength and end wavelength.
- Choose your excitation source: either the UV light source, or select a particular excitation wavelength using the tunable light source.
- Start the measurement.
- This excitation wavelength is fixed and the system cycles through various emission wavelengths measuring emitted intensity.
- This will give a plot of emission intensity at various wavelengths for a given excitation energy.
For Photoluminescence Excitation (PLE) measurements:
- Place your sample in the spectrofluorometer.
- Navigate to the Excitation measurement tab in the Spectrophotometry software.
- Define wavelength range as described for emission measurements.
- You also need to define an emission wavelength at which the emission will be measured.
- The tunable light source will cycle through the defined wavelength range, with the detector measuring the intensity of light at the emission wavelength.
- This will give a plot of emitted intensity at a specific wavelength under various excitation energies.
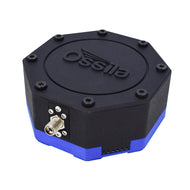
Measuring PL with the Ossila USB Spectrometer
To measure PL with a USB spectrometer, you will need an independent UV light source. You will also need to position an optical filter between the sample and spectrometer, to remove the excitation signal.
Alternatively, users can optimize measurement angle to significantly reduce the excitation signal. For example, measuring at 45 degrees to the angle of incidence will drastically reduce excitation signal intensity, whilst minimizing reflection effects.
The USB spectrometer will measure the intensity of all emitted wavelengths of light simultaneously. These sensitivity of these set ups can be improved by using optical fibers as photoluminescence signals can be very low.
Things to remember when measuring photoluminescence
- For solid samples, you will find that photoluminescence measurements are more sensitive to minor defects or changes in structure than absorbance measurements. For example, the introduction of trap states in a semiconductor material can quench the luminescence completely, while not changing the bulk absorbance properties.
- For CCD-based spectrometers, such as the Ossila USB Spectrometer, increasing measurement integration time will increase the size of your signal. Optimize this to increase signal, while ensuring is still below the saturation level of the detector.
- You can reduce the signal-to-noise ratio by averaging your spectra over several measurements. This is referred to as spectral averaging.
- You can adjust gain if you need to amplify the signal from your sample, for example if the photoluminescence signal is particularly weak. Although, keep in mind that this will also amplify noise level in your signal.
- If you are measuring multiple samples, ensure that your setup stays the same throughout. Factors that can affect photoluminescence intensity include the source intensity and wavelength, sample orientation, detector angle and distances between the excitation source, sample, and detector. If you change these factors between measurements, your results may not be comparable.
- Without using an integrating sphere, your measured photoluminescence intensities will not be reliable. You can compare emission intensities between samples if all other factors are kept the same. However, do not rely solely on these measurements for quantitative information. Other techniques, such as electron quantum efficiency measurements, can provide more quantitative data.
Equipment Setup Tips
One important thing to remember about photoluminescence is that photons are emitted in all directions. This means that, unlike in absorbance and transmittance spectroscopy, there is no "ideal" place to put your spectrometer.
It is important that you optimize the arrangement of your system to work best for your sample. This optimal set-up will depend on factors such as the amount of photoluminescence emitted by your sample, your film thickness or sample concentration as well as the amount of background light in your lab environment.
Remember that if you are measuring at only one angle, you are only ever detecting a fraction of the total photoluminescence. Therefore, photoluminescence intensity values will not be absolute. If your sample is in the form of a thin film, you can assume that the majority of photoluminescence will be emitted from the largest surface area of the sample (i.e. the front and back of the film). Therefore, it is beneficial to put the samples in the pathway of the excitation source, as you would do in absorbance spectroscopy.
Photoluminescence Quantum Efficiency
Photoluminescence quantum efficiency (or photoluminescent quantum yield) compares the number of photons emitted by a sample to the number of photons that have been absorbed. You can use this measurement to determine the suitability of your sample for use in laser pumping, solar cells or in LED technology. It will also inform you about the optical properties of your material, and about the amount of non-radiative recombination there is in your sample.
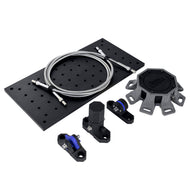
Typically, photoluminescence quantum yield measurements use an integrating sphere fiber coupled with the USB spectrometer. It is important to place your sample at the center of the sphere at a slight angle. This is so that the light isn't directly reflected back out of the entrance port and irradiated by a monochromatic light source such as a laser. You should also ensure that the photon energy of your light source is higher than that of the sample emission. This makes sure that the sample has a non-zero absorption at the incident wavelength.
The inside of the sphere is coated with a diffuse, white reflective layer, which, through multiple reflections, distributes the light isotopically over the sphere's inner surface. Outgoing light, which consists of both source photons and sample emission, is then collected by the fiber.
Finally, in order to achieve a reliable measurement, you will need to take a control measurement. If your sample is a solution, your control should be a cuvette containing the solvent used. If you are using a thin film, it should be a blank substrate. A typical PLQE setup is shown in the figure below.

You can then compare your two spectra to calculate the amount of light absorbed and emitted by the sample. In the example PLQE data shown below, a portion of the excitation source is absorbed (red shaded region) when the sample is placed inside the sphere. Some of this light is re-emitted at longer wavelengths (blue shaded region). The PLQE, Φ, is then given by

In practice, this is usually calculated by integrating the two shaded regions.

If the sample's absorption and PL spectra overlap, it can reabsorb some of the photons that it emits after they've been reflected from the sphere's inner surface. In this case, the PL emission in the integrating sphere measurements will have a different shape, with a reduction in emission at the high energy end - this is illustrated in the figure below. Due to this we recommend using a self-absorption correction that uses the actual PL spectrum [1].

The PLQE of a material depends on its electronic and vibrational energy levels. When a photon is absorbed, the excited electron can either decay radiatively or non-radiatively. If it decays radiatively, a photon will be released. If it decays non-radiatively, however, a photon will not be released. The PLQE is hence related to the radiative (fluorescence) rate, kr, and the sum (Σ) of all the non-radiative, knr, rates through:

Φ is strongly affected by the molecules' environment - for example, solvent polarity. It can also be affected by aggregation. Aggregation can occur when molecules form complexes in the ground state and the electronic properties of the molecule are altered. This can result in broadened or shifted absorption and emission spectra and often results in an increase in non-photoluminescent pathways and therefore a decreased PLQE. This is the case with aromatic molecules (those that contain planar, cyclic structures, such as benzene), which undergo π-π stacking, and when hydrophobic molecules are placed in polar solvents. Additionally, the close proximity of molecules in the solid state also increases the effects of aggregation if the length scales are short enough to allow energy transfer and intramolecular charge transfer to occur.
For this reason, thin films often have significantly reduced PLQEs compared to solutions. It is possible to reduce the effects of aggregation in films by dispersing the molecules in a transparent polymer matrix such as polystyrene or poly(methyl methacrylate) (PMMA). This is done simply by adding the polymer to the dye solution and processing as normal - for example, through spin coating. The polymer will help to space out the dye molecules, reducing intermolecular interactions and reducing aggregation. By increasing the concentration of polymer relative to the dye, aggregation can be further reduced; however, this is accompanied by a reduced absorption, which may not be desirable.
Steady-State vs. Time-Resolved Photoluminescence Spectroscopy
Steady-state photoluminescence (or steady state photoluminescence) only measures photoluminescence intensity as a function of wavelength at a given point in time. Therefore, you can use steady-state spectroscopy when the photoluminescence intensity of your sample doesn't change with continued illumination. It is also appropriate to use when the fluorescence intensity of your sample changes after at least >1 second.
Time-resolved photoluminescence spectroscopy (or time-resolve photoluminescence spectroscopy) can be used to study fast radiation processes occurring over a very short time scale (from milliseconds to picoseconds). Here, rather than the constant illumination used in steady-state photoluminescence, you excite the sample with a short, high energy pulse and detect photoluminescence over time.
You will need very sophisticated equipment to perform time-resolved photoluminescence, including an extremely sensitive detector and a dark-room environment. Often, you may need to bring the temperature of your samples down to extremely cold temperatures to extend the lifetime of these excited states long enough for them to be observed. For this, you would need to use other specific equipment such as cryostat.
Interpreting Photoluminescence Spectra
There is plenty of information you can find out about your sample using photoluminescence spectroscopy. Often, you will have to take several factors into account to see the whole picture. Some of the key features to examine include:
Peak Shift in PL spectrum
The location of photoluminescence peaks is the first thing to notice when studying photoluminescence spectra. You can work out the transition energy from the wavelength of the emission maxima using the photon-energy equation. If this peak shifts to a higher or lower wavelength than expected, this could indicate a change the bulk material properties such as the material band gap. Movement of these emission peaks could also be due to aggregation of molecules, such as for the formation of excimers, or due to increased conjugation in a polymer.
Photoluminescence Intensity
Photoluminescence intensity can show many things about the optical properties of your sample (the amount of radiative vs. non-radiative processes, the amount of quenching occurring, if there is re-absorbance occurring within your sample). Without using of an integrating spere, measurements of photoluminescence intensity should be used comparatively, not quantitatively. However, by using an optical spectrometer, you can measure if there is notable change in photoluminescence intensity in your sample compared to a control.
Additionally, if you have used photoluminescent materials to label certain molecules in your system, you can measure the abundance of these molecules during or after an event through PL intensity. In this case, photoluminescence will be linearly proportional to the concentration of fluorophores in your sample, solution, or culture.
Full Width Half Maximum
The full width half maximum of your sample can supply useful information about its homogeneity. If the linewidth of your peak gets broader, the fluorescing material is more polydisperse or inhomogeneous. In colloidal dispersions (such as luminescent quantum dots), an increase in polydispersity could imply a broader range of colloid size, shape or the presence of defects or imperfections in your colloids. In thin films, an increase in line width could suggest an increase in the number of defects, trap states or non-radiative recombination centers within the film.
Evolving Peaks
You may notice that as you continually illuminate your sample, the photoluminescence intensity increases or decrease with time. There are many things can cause this. For example, decreasing photoluminescence intensity with time could imply there is photoluminescence quenching happening in your sample. If the sample is a thin film in contact with a transport layer, this can be used to measure how well the charge can be extracted from the absorbent layer. On the other hand, it has been observed that PL intensity can increase with time in semiconductors due to interstitial vacancies. Initially, the first electrons that are excited fill these traps states, and the amount of radiative recombination is low. However, over time these trap states remain occupied, and electrons can relax radiatively from the S1 state. Therefore, the amount of radiative recombination increases. Depending on time frame of this intensity change, this can be measured with steady-state (lifetimes >1 s) or time-resolved photoluminescence (picoseconds-milliseconds) spectroscopy.
Example of Photoluminescence Spectroscopy

Here is an example of photoluminescence of BODIPY with increasing dye concentration. There is plenty you can tell about this molecule from the photoluminescence peak placement and intensities. Increasing the concentration of BOPIDY-Br from 1% to 5% increases photoluminescence intensity. After this, photoluminescence intensity decreases with increased concentration. We also see an increase in photoluminescence at around 600 nm, as fluorophore concentration increases.
We also found that the emission maxima shifted with increased concentration. All these factors indicate that there is aggregation occurring within the solution with increased dye concentration, in particular that excimers are forming with increased BODIPY-Br concentration.
Spectrofluorometer

Learn More
 Fluorescence and Phosphorescence
Fluorescence and phosphorescence are types of photoluminescence. Photoluminescence refers to radiative emissions where the absorbance of a photon is followed by the emission of a lower energy photon.
Read more... Measuring Fluorescence with the Ossila Spectrofluorometer
The Ossila Spectrofluorometer measures the fluorescence emission spectra of materials with high sensitivity and precision. The spectrofluorometer can take both excitation and emission measurements with the free Spectrophotometry software.
Read more...References
- T.-S. Ahn, et al. Rev. Sci. Instrum. 78, 086105 (2007).
Contributing Authors
Written by
PhD Student Collaborator
Reviewed by
Application Scientist