The AM1.5 Spectrum
Solar irradiance varies depending on where you are in the world. This is because of a combination of local atmospheric conditions and geometric considerations. The tropics, for example, receive more irradiance on average than the equator due to a lower prevalence of clouds, which reflect much of the incoming solar radiation.

This variation in the solar irradiance would make it extremely difficult to compare the performance of different solar cell technologies measured in different locations, even if you kept the time of day and year kept consistent. For this reason, it is necessary to have ‘standardised’ solar spectra. These spectra function as a universally accepted reference for testing and comparing photovoltaic devices.
The first standardised solar spectrum came from the International Commission on Illumination (CIE) in 1972 and represented the solar noon sun at the equator on an equinox (θs = 0°) with no cloud but a defined volume of water vapour, ozone and aerosols in the atmosphere. They also suggested using an irradiance of 1000 W/m2 in the 290 nm – 3000 nm wavelength range as a reference intensity.
This reference spectrum has been refined over the years. In 1982 the American Society for Testing and Materials (ASTM) published two calculated reference spectra that would become the basis for standardised solar cell testing:
- A direct normal irradiance spectrum (AM1.5D)
- A global horizontal irradiance spectrum (AM1.5G)
AM1.5G is the spectrum generally used in terrestrial solar cell research. Solar simulators are classified based on their spectral match to the AM1.5 spectrum.
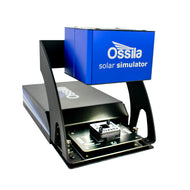
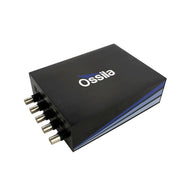
Solar Cell Testing Kit

- Unbeatable Value
- Easy Cell Characterization
- Intuitive Software
Worldwide Delivery £3800

The ‘AM1.5’ in both reference spectrums refers to the air mass used in calculating the spectra. Air mass is a measure of how much atmosphere the light has passed through. An air mass of 1 (AM1) indicates the amount of atmosphere sunlight would pass through at a solar zenith angle of θs = 0° and is the shortest path possible through the atmosphere to the ground. An air mass of 1 corresponds to approximately 9 km of effective atmosphere (although the atmosphere extends far further than this, most of the absorption and scattering occurs in the lower 9 km). An air mass of 2 (AM2) would be double the air mass of AM1.
The air mass and solar zenith angle are related through:

A special case is AM0, which indicates the light has not passed through any atmosphere and therefore corresponds to light at the top of the atmosphere. The AM0 spectrum may be used for testing solar cells designed for use in space e.g., on satellites.
AM1.5 was chosen as the ‘standard’ for terrestrial solar cell testing because it is a good representation of the yearly average irradiance in the temperate latitudes where there are many large population centres.
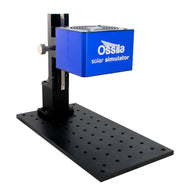
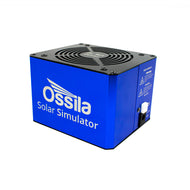
Solar Simulator

- Class AAA
- Small Area
- Programmable LED Lamp
Available From £2200
Contributing Authors
Edited by
Application Scientist
Reviewed by
Product Specialist